


Translate among verbal, tabular, graphical, and algebraic representations of linear functions.
Remarks
Example: Jan started with $25 and saved $5 each week. Bill started at the same time with no money and saved $10 per week. Make a table to display the data, write an equation to show the amount of money each person has each week, and graphically display the situation. Explain the relationship between different representations of the same data.General Information
Subject Area: X-Mathematics (former standards - 2008)
Grade: 8
Body of Knowledge: Algebra
Idea: Level 2: Basic Application of Skills & Concepts
Big Idea: BIG IDEA 1 - Analyze and represent linear functions, and solve linear equations and systems of linear equations.
Date Adopted or Revised: 09/07
Content Complexity Rating:
Level 2: Basic Application of Skills & Concepts
-
More Information
Date of Last Rating: 06/07
Status: State Board Approved - Archived
Assessed: Yes
Test Item Specifications
-
Item Type(s):
This benchmark may be assessed using:
MC
item(s)
- Clarification :
Students will identify an alternate representation of a function given in a rule, a table, a graph, or other symbolic representation. - Content Limits :
Functions may include points from all four quadrants.
Values in equations should be rational numbers.
Items should present a table or graph and ask the student to identify another representation of the given function. - Stimulus Attributes :
Items may be set in either a real-world or mathematical context.
Graphics should be used for all of these items.
Sample Test Items (1)
- Test Item #: Sample Item 1
- Question: The graph below shows the linear relationship between the total sales at a thrift shop and the amount the thrift shop spent on food for a homeless shelter.
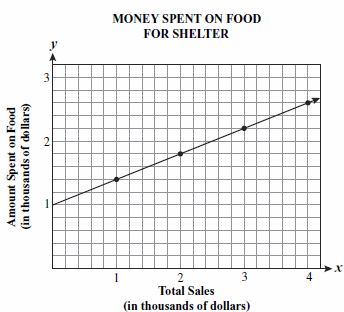
Which equation best represents the relationship shown in the graph?
- Difficulty: N/A
- Type: MC: Multiple Choice
Related Access Points
Alternate version of this benchmark for students with significant cognitive disabilities.
Related Resources
Vetted resources educators can use to teach the concepts and skills in this benchmark.
Lesson Plans
Problem-Solving Task
Tutorial
Student Resources
Vetted resources students can use to learn the concepts and skills in this benchmark.
Tutorial
Graphing Linear Functions:
This is a video which explicitly demonstrates graphing linear functions using the x- and y-intercepts.
Type: Tutorial
Parent Resources
Vetted resources caregivers can use to help students learn the concepts and skills in this benchmark.

