


General Information
Related Benchmark: MA.8.A.1.5
Reporting Category: Algebra
Type: MC: Multiple Choice
Difficulty: N/A
Question:
The graph below shows the linear relationship between the total sales at a thrift shop and the amount the thrift shop spent on food for a homeless shelter.
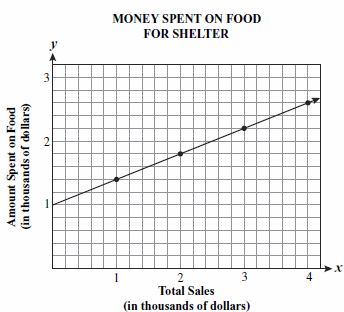
Which equation best represents the relationship shown in the graph?
Answer Options:
A. y = 2/5x + 1
B. y = 5/2x + 1
C. y = 2x + 5
D. y = 5x + 2
B. y = 5/2x + 1
C. y = 2x + 5
D. y = 5x + 2
Answer Key:
A
Item Context:
Social Studies/Consumerism

