MA.6.S.6.1Archived Standard

Determine the measures of central tendency (mean, median, mode) and variability (range) for a given set of data.

Remarks

Students should make frequency tables for numerical or categorical data, grouping data in different ways to investigate how different groupings describe the data.


This is the first time in 2007 Florida mathematics standards that students are expected to use mean, median, mode, and range in a formal sense to describe a set of data.

General Information
Subject Area: X-Mathematics (former standards - 2008)
Grade: 6
Body of Knowledge: Statistics
Idea: Level 1: Recall
Supporting Idea: Data Analysis - Data Analysis
Date Adopted or Revised: 09/07
Content Complexity Rating: Level 1: Recall - More Information
Date of Last Rating: 06/07
Status: State Board Approved - Archived
Assessed: Yes
Test Item Specifications
  • Item Type(s): This benchmark may be assessed using: MC , GR item(s)

  • Clarification :
    Students will determine the mean, median, mode, or range for a given set of data.
  • Content Limits :
    Items may include data presented in a table, line plot, bar graph, double bar graph, or line graph. 

    The number of data points may not exceed ten when the median or mode is being determined. 

    The number of data points may not exceed six when the mean is being calculated.

    Items may include the use of frequency tables for numerical or categorical data. 

    Items may include the use of whole numbers; fractions with denominators of 2, 4, or 10; or decimal values, which may include 0.25, 0.75, or tenths.

  • Stimulus Attributes :
    Items should be set in a real-world context.
Sample Test Items (2)
  • Test Item #: Sample Item 1
  • Question: The table below shows information about the 10 most-collected special edition stamps in the United States as of 1998.

    Table

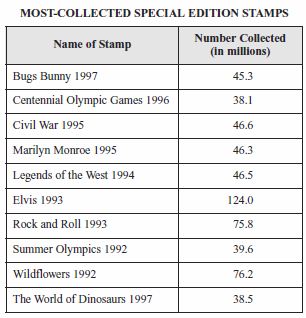
    For the stamps listed in the table, what is the median number collected, in millions?

  • Difficulty: N/A
  • Type: MC: Multiple Choice

  • Test Item #: Sample Item 2
  • Question: The bar graph below shows the number of cars sold by each of 5 car salespeople during the same month.

    Bar Graph

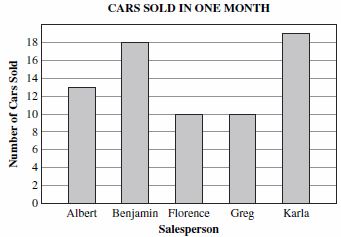
    What is the mean number of cars sold during this month for these 5 salespeople?

  • Difficulty: N/A
  • Type: GR: Gridded-Response

Related Access Points

Alternate version of this benchmark for students with significant cognitive disabilities.

Related Resources

Vetted resources educators can use to teach the concepts and skills in this benchmark.

Lesson Plans

Calculating the Mean, Median, Mode, and Range from a Frequency Chart:

This lesson lasts a total of two hours: 15-minute pre-lesson, 90-minute lesson, and 15-minute follow up lesson or homework. Students will need the two worksheets, a mini-whiteboard, a pen, and an eraser. Each small group will need both card sets, a large sheet of paper, and a glue stick. Students will generate responses to a question about favorite computer games and use this data for the lesson. Students will then work collaboratively to display different data and discuss various strategy approaches.

Type: Lesson Plan

Flipping the house:

The Gonzalez family is moving to Florida and they need our students' help deciding which neighborhood to live in. To help them, the students will calculate the mean and median of home prices in the neighborhood and trends in price changes.

Model Eliciting Activities, MEAs, are open-ended, interdisciplinary problem-solving activities that are meant to reveal students’ thinking about the concepts embedded in realistic situations. MEAs resemble engineering problems and encourage students to create solutions in the form of mathematical and scientific models. Students work in teams to apply their knowledge of science and mathematics to solve an open-ended problem while considering constraints and tradeoffs. Students integrate their ELA skills into MEAs as they are asked to clearly document their thought processes. MEAs follow a problem-based, student-centered approach to learning, where students are encouraged to grapple with the problem while the teacher acts as a facilitator. To learn more about MEAs visit: https://www.cpalms.org/cpalms/mea.aspx

Type: Lesson Plan

The Survey Says...:

Students will work in groups to conduct class surveys, using the results of the survey to calculate various measures of central tendency.

Type: Lesson Plan

Exploring Central Tendency:

Students will review measures of central tendency and practice selecting the best measure with real-world categorical data. This relatable scenario about ranking the characteristics considered when purchasing a pair of sneakers, is used to finally answer the age-old question of "When will I ever use this?".

Type: Lesson Plan

Data Doctors:

Have your students become "Data Doctors" by examining and analyzing means of central tendency. This lesson is a great introduction to mean, median, mode and range. Students will be sets of data, get to work in small groups examining the sets, view a poem that will help them remember each term, and take surveys to get real data sets.

Type: Lesson Plan

Candy Colors: Figuring the Mean, Median & Mode:

In this lesson, students will count candy of different colors and use the data to calculate the mean, median, and mode. Groups of students will work together to share their data and calculate the measures of central tendency again. At the end of the lesson, they will apply their learning to another data collection.

Type: Lesson Plan

STEM Lessons - Model Eliciting Activity

Flipping the house:

The Gonzalez family is moving to Florida and they need our students' help deciding which neighborhood to live in. To help them, the students will calculate the mean and median of home prices in the neighborhood and trends in price changes.

Model Eliciting Activities, MEAs, are open-ended, interdisciplinary problem-solving activities that are meant to reveal students’ thinking about the concepts embedded in realistic situations. MEAs resemble engineering problems and encourage students to create solutions in the form of mathematical and scientific models. Students work in teams to apply their knowledge of science and mathematics to solve an open-ended problem while considering constraints and tradeoffs. Students integrate their ELA skills into MEAs as they are asked to clearly document their thought processes. MEAs follow a problem-based, student-centered approach to learning, where students are encouraged to grapple with the problem while the teacher acts as a facilitator. To learn more about MEAs visit: https://www.cpalms.org/cpalms/mea.aspx

Student Resources

Vetted resources students can use to learn the concepts and skills in this benchmark.

Parent Resources

Vetted resources caregivers can use to help students learn the concepts and skills in this benchmark.