


General Information
Related Benchmark: MA.6.S.6.1
Reporting Category: Statistics
Type: GR: Gridded-Response
Difficulty: N/A
Question:
The bar graph below shows the number of cars sold by each of 5 car salespeople during the same month.
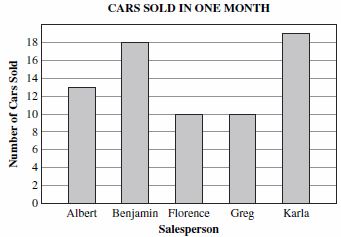
What is the mean number of cars sold during this month for these 5 salespeople?
Possible Answer:
sample response 14
sample response 14
Item Context:
Social Studies/Consumerism

