MA.6.A.3.6Archived Standard

Construct and analyze tables, graphs, and equations to describe linear functions and other simple relations using both common language and algebraic notation.

Remarks

Example 1: Each unicycle made needs 1 wheel. Explain why w=u where w is the number of wheels and u is the number of unicycles describes this relationship.

Example 2: Each bicycle made needs 2 wheels. Explain why w=2b where w is the number of wheels and b is the number of bicycles describes this relationship.

Example 3: Each tricycle made needs 3 wheels. Explain why w=3t where w is the number of wheels and t is the number of tricycles describes this relationship.

Example 4: Below is a graph of the relationships in Examples 2 and 3. Explain why one of the lines is steeper than the other line.

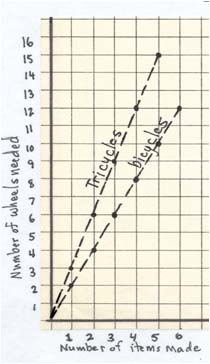
what would the graph of w=u look like?
General Information
Subject Area: X-Mathematics (former standards - 2008)
Grade: 6
Body of Knowledge: Algebra
Idea: Level 3: Strategic Thinking & Complex Reasoning
Big Idea: BIG IDEA 3 - Write, interpret, and use mathematical expressions and equations.
Date Adopted or Revised: 09/07
Date of Last Rating: 06/07
Status: State Board Approved - Archived
Assessed: Yes
Test Item Specifications
  • Item Type(s): This benchmark may be assessed using: MC item(s)

  • Clarification :
    Students will identify a table, graph, or equation that represents a linear function or other simple relationship.

    Students will analyze a table or graph to identify or describe the rate of change.

    Students will identify different representations of the same relationship, including translating among graphs, equations, tables, and words.
  • Content Limits :
    Items may include tables, graphs, equations, or real-world situations.

    Simple relationships may include discrete data that lends itself to a linear relationship.

    Graphs should be limited to the first quadrant, and indicated points on the graphs must have whole-number coordinates.

    Items will not include the use of the slope formula.
  • Stimulus Attributes :
    Items should be set in a real-world or mathematical context.
Sample Test Items (1)
  • Test Item #: Sample Item 1
  • Question: A cellular phone company charges a fixed monthly fee, plus $0.25 for each minute the phone is in use. The table shows that T, the total charge for one month, depends on m, the number of minutes the phone is in use.

    Table

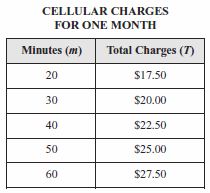
    Which equation correctly shows the relationship between T and m?

  • Difficulty: N/A
  • Type: MC: Multiple Choice

Related Access Points

Alternate version of this benchmark for students with significant cognitive disabilities.

Related Resources

Vetted resources educators can use to teach the concepts and skills in this benchmark.

Educational Software / Tool

Free Graph Paper:

A variety of graph paper types for printing, including Cartesian, polar, engineering, isometric, logarithmic, hexagonal, probability, and Smith chart.

Type: Educational Software / Tool

Lesson Plans

Average Speed and Graphing:

Students learn how to calculate average speed and how to construct and interpret a distance vs time graph.

Type: Lesson Plan

Shake it up around the world:

ResourceID: 39599

This lesson will allow students to investigate the location of earthquakes and volcanoes throughout the world and determine how they relate to the tectonic plates.

Type: Lesson Plan

Problem-Solving Task

Drip, Drop, Drip, Drop:

Students design an experiment to model a leaky faucet and determine the amount of water wasted due to the leak. Using the data they gather in a table, students graph and write an equation for a line of best fit. Students then use their derived equation to make predictions about the amount of water that would be wasted from one leak over a long period of time or the amount wasted by several leaks during a specific time period.

Type: Problem-Solving Task

Teaching Idea

Weather or Not? (NCTM) - Featured for Math and Science Day:

These activities give students opportunities to investigate weather conditions that involve reading and recording temperatures, graphing, making charts, solving word problems, and working with numbers.

Used with permission from Teaching Children Mathematics, copyright April 2008 by the National Council of Teachers of Mathematics. All rights reserved.

Type: Teaching Idea

Virtual Manipulative

Graphing Equations Using Intercepts:

This resource provides linear functions in standard form and asks the user to graph it using intercepts on an interactive graph below the problem. Immediate feedback is provided, and for incorrect responses, each step of the solution is thoroughly modeled.

Type: Virtual Manipulative

Student Resources

Vetted resources students can use to learn the concepts and skills in this benchmark.

Virtual Manipulative

Graphing Equations Using Intercepts:

This resource provides linear functions in standard form and asks the user to graph it using intercepts on an interactive graph below the problem. Immediate feedback is provided, and for incorrect responses, each step of the solution is thoroughly modeled.

Type: Virtual Manipulative

Parent Resources

Vetted resources caregivers can use to help students learn the concepts and skills in this benchmark.