


Determine if a specific model is consistent within a given process by analyzing the data distribution from a data-generating process.
General Information
Subject Area: Mathematics (B.E.S.T.)
Grade: 912
Strand: Data Analysis and Probability
Date Adopted or Revised: 08/20
Status: State Board Approved
Benchmark Instructional Guide
Connecting Benchmarks/Horizontal Alignment
- MA.912.DP.1.1
- MA.912.DP.1.2
- MA.912.DP.2.1
- MA.912.DP.2.4
- MA.912.DP.2.5
- MA.912.DP.2.7
- MA.912.DP.2.9
- MA.912.DP.3.1
Terms from the K-12 Glossary
- Association
- Bivariate data
- Categorical data
- Mean
- Mode
- Random sampling
Vertical Alignment
Previous Benchmarks
Next Benchmarks
Purpose and Instructional Strategies
In previous grades, students have worked with numerical, categorical, univariate, and bivariate data as an introduction to statistical analysis. In Mathematics for College Statistics, students apply this previous knowledge of data analysis to surveys, observational studies and experiments. It is essential to check that the statistical study results in data that is consistent with the model being used. This examination can and should occur in a variety of areas.- Instruction includes determining if the data generated from a random sample or
simulation is displayed in an appropriate manner.
- For example, bivariate numerical data can be displayed in a scatter plot, while bivariate categorical data can be displayed in a two-way table (or contingency table).
- When instruction centers around Pearson’s correlation coefficient and the linear regression equation for numerical bivariate data, students should consistently check that the scatter plot that corresponds with the data is linear. Data displayed in a scatter plot that shows a non-linear pattern should use non-linear regression methods.
- Instruction centering around surveys, observational studies and experiments should include a process of ensuring the correct statistical study is chosen for the outcome that is desired.
- If simulations or experiments are conducted during lessons, it is important to analyze the
results to see if they are consistent with what is expected based on prior knowledge about
the scenario. Unusual results can lead to conversations about natural random variation
and statistical significance.
- For example, suppose that a teacher says that he has ESP, or the ability to read minds and/or the ability to know the future. In order to test his abilities, his students have him guess the colors of 10 randomly drawn cards from a standard deck of 52 cards. If the teacher did not have ESP, we would expect him to guess approximately 50% of the cards’ colors correctly (there are two colors – red and black). If he did have ESP, he would be able to get a significantly higher percentage. Suppose he predicts the colors of the cards, and he gets 9 out of 10 colors correct. What should be concluded from the data generated? Does the teacher have ESP? Is the data consistent with the model?
- Instruction includes a discussion on the uncertainty of using samples to make predictions about a population, which is statistical inference. When using sample statistics, we are never 100% certain that we can know the exact value of a population parameter, especially when a population is large. Reconciling natural sampling variation and uncertainty can be difficult, and there are even times when the assertions that are made from samples are incorrect. This can lead into areas such as type I and type II errors in a college statistics course.
Common Misconceptions or Errors
- Students may be unaccustomed to the overall “messiness” of statistics. There are times where results are inconclusive, or there is not one right answer (like x = 2 in algebra) and range of possibilities is discussed.
- Students may incorrectly conclude that the value of a sample statistic has to be equal to the value of a population parameter.
- Students may be in the habit of making calculations without considering whether or not the calculation is appropriate. For example, a student may be asked to find the center of a univariate numerical data set and find the mean; however, when the data set is skewed a median may be more appropriate.
Instructional Tasks
Instructional Task 1 (MTR.4.1, MTR.7.1)- A weather website makes the claim that average daily high temperature in December in Pensacola Florida is 65 degrees Fahrenheit. In order to investigate this claim, a simple random sample of 66 daily high temperatures over the last 10 years is taken. The results are in the dot below.
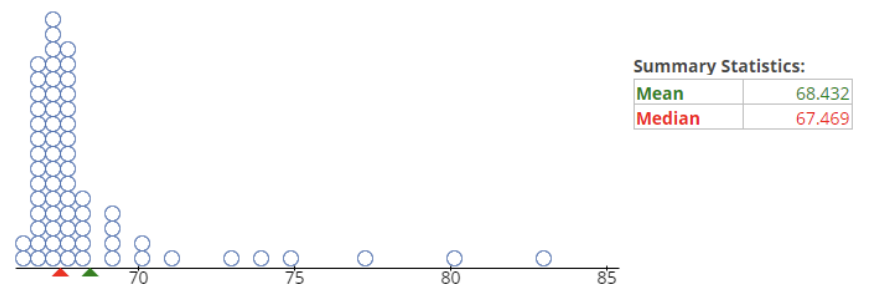
- Part A. What does each dot in the display represent?
- Part B. The website claims that the mean daily high temperature in Pensacola is 65 degrees Fahrenheit, but the sample statistic is a mean of around 68.4 degrees Fahrenheit. Is this difference due to natural sampling variation, or does the sample show that the average temperature may have been higher over the last 10 years? Explain your reasoning.
- Part C. If another simple random sample of 66 days was taken, do you think we would get the same results as the sample above? Explain.
- Part D. Would you come to a different conclusion in Part B if the mean for a second sample of 66 days in December in Pensacola had a mean of 67.3 degrees Fahrenheit? Discuss your reasoning with a classmate.
Instructional Items
Instructional Item 1- The size of a population of a particular bacterium is studied and estimated in a petri dish over several days. The corresponding data and scatter plot are below.

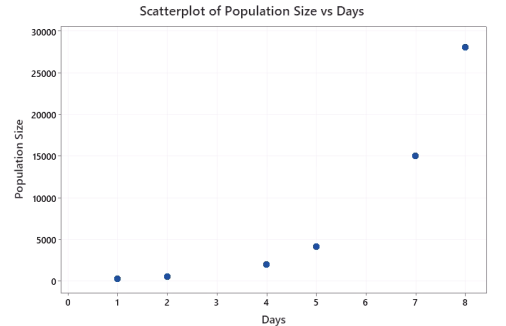
- The linear regression equation is calculated to be Predicted Population Size = −7809 + 3583(Days). Do you feel this linear model accurately describes the population growth of the bacteria? Explain your reasoning.
Related Courses
This benchmark is part of these courses.
1210300: Probability and Statistics Honors (Specifically in versions: 2014 - 2015, 2015 - 2019, 2019 - 2022, 2022 - 2024, 2024 and beyond (current))
1210305: Mathematics for College Statistics (Specifically in versions: 2022 - 2024, 2024 and beyond (current))
1209315: Mathematics for ACT and SAT (Specifically in versions: 2022 - 2024, 2024 and beyond (current))
Related Access Points
Alternate version of this benchmark for students with significant cognitive disabilities.
Related Resources
Vetted resources educators can use to teach the concepts and skills in this benchmark.
Lesson Plan
Perspectives Video: Experts
Perspectives Video: Professional/Enthusiasts
Problem-Solving Tasks
Text Resource
Student Resources
Vetted resources students can use to learn the concepts and skills in this benchmark.
Perspectives Video: Expert
MicroGravity Sensors & Statistics:
Statistical analysis played an essential role in using microgravity sensors to determine location of caves in Wakulla County.
Download the CPALMS Perspectives video student note taking guide.
Type: Perspectives Video: Expert
Parent Resources
Vetted resources caregivers can use to help students learn the concepts and skills in this benchmark.

