


Determine whether a data distribution is symmetric or skewed based on an appropriate graphical presentation of the data.
Remarks
Example: The graph below shows the probability density function of a continuous distribution. Determine whether the distribution is skewed left, skewed right, or symmetric.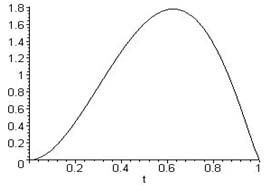
General Information
Subject Area: X-Mathematics (former standards - 2008)
Grade: 912
Body of Knowledge: Statistics
Idea: Level 1: Recall
Standard: Summarizing Data (Descriptive Statistics) - Learn to work with summary measures of sets of data, including measures of the center, spread, and strength of relationship between variables. Learn to distinguish between different types of data and to select the appropriate visual form to present different types of data.
Date Adopted or Revised: 09/07
Content Complexity Rating:
Level 1: Recall
-
More Information
Date of Last Rating: 06/07
Status: State Board Approved - Archived
Related Access Points
Alternate version of this benchmark for students with significant cognitive disabilities.
Related Resources
Vetted resources educators can use to teach the concepts and skills in this benchmark.
Virtual Manipulative
Student Resources
Vetted resources students can use to learn the concepts and skills in this benchmark.
Virtual Manipulative
Histogram Tool:
This virtual manipulative histogram tool can aid in analyzing the distribution of a dataset. It has 6 preset datasets and a function to add your own data for analysis.
Type: Virtual Manipulative
Parent Resources
Vetted resources caregivers can use to help students learn the concepts and skills in this benchmark.

