


Examples
A mechanic wants to place an ad in his local newspaper. The cost, in dollars, of an ad x inches long is given by the following piecewise function. Find the cost of an ad that would be 16 inches long.
Clarifications
Clarification 1: Key features are limited to domain, range, intercepts, asymptotes and end behavior.Clarification 2: Instruction includes representing the domain, range and constraints with inequality notation, interval notation or set-builder notation.
Benchmark Instructional Guide
Connecting Benchmarks/Horizontal Alignment
Terms from the K-12 Glossary
- Coordinate plane
- Domain
- Function
- Function notation
- Piecewise function
- Range (of a relation or a function)
- Rate of change
- Set-builder notation
- -intercept
- -intercept
Vertical Alignment
Previous Benchmarks
Next Benchmarks
Purpose and Instructional Strategies
In Algebra I, students worked with linear, quadratic, absolute value and exponential functions. In Math for Data and Financial Literacy, students work with piecewise functions, interpret the key features of their graphs, and determine constraints in terms of the context.- Instruction includes real-world problems that can be modeled with piecewise functions (MTR.7.1).
- It is important for students to understand that a piecewise function is a function defined by multiple sub functions, each of which applies to a certain interval defined by the function’s domain.
- For mastery of this benchmark within this course, sub functions are limited to linear, quadratic and exponential.
- Instruction includes the use of - notation and function notation.
- Instruction includes representing domain, range and any constraints using words,
inequality notation, set-builder notation and interval notation.
- Words
If the domain is all real numbers, it can be written as “all real numbers” or “any value of , such that is a real number.”
- Inequality notation
If the domain is all values of greater than 2, it can be represented as > 2.
- Set-builder notation
If the range is all values of less than or equal to zero, it can be represented as {| ≤ 0} and is read as “all values of such that is less than or equal to zero.”
- Interval notation
If the domain is all values of less than or equal to 3, it can be represented as (−∞, 3]. If the domain is all values of greater than 3, it can be represented as (3, ∞). If the range is all values greater than or equal to −1 but less than 5, it can be represented as [−1, 5).
- This benchmark expects students to interpret key features and determine constraints in terms of the context of a real-world problem (MTR.7.1).
- For the example used in the benchmark, the piecewise function models the cost, in dollars, of an ad inches long. The key features and constraints are as follows.
- The domain of a function is the complete set of possible values of the input of a function or relation. The input values in this case are the size in inches of the ad length. The minimum ad length someone could possibly have is 0 inches. The maximum ad length (based on the length of traditional newspapers in the United States) would be the length of a full page, which is approximately 21 inches. The set of inputs could be considered continuous within the minimum and maximum since the length is not limited to only whole numbers. Therefore, a reasonable domain for this context would be any length from 0 to 21 inches.
- The range of a function is the complete set of possible values of the output of a function or relation. In this case, the output is the cost of the ad. The minimum cost of an ad would be 0 if the ad size length is 0. This function uses the subset function 12 when < 5. The upper bound of the cost for this subset would be 12(5), or 60, but does not include 60. Once the size of the ad reaches 5 inches in length, the subset function 60 + 8( − 5) is used. The lowest cost for this subset would be 60 + 8(5 − 5) = 60 and the highest cost for that subset would be 60 + 8(21 − 5) = 188. Overall, the lowest cost would be 0 and the highest cost would be 188, so the range is all values between 0 and 188, inclusive.
- The -intercept occurs when the output value is 0. The -intercept occurs when the input value is 0. In this case, the -intercept occurs when the cost of the ad is equal to 0. The cost of the ad is 0 when the length of the ad is 0 inches. The ()-intercept is the starting cost of the ad when the ad length is 0. The starting cost of the ad when the ad length is 0 is 0 dollars. Therefore, the -intercept and the ()-intercept is the origin (0,0).
- For the example used in the benchmark, the piecewise function models the cost, in dollars, of an ad inches long. The key features and constraints are as follows.
Common Misconceptions or Errors
- When evaluating a piecewise function for a specific input, students may attempt to substitute the input value into the wrong subset function or may try to substitute the input value into all the subset functions.
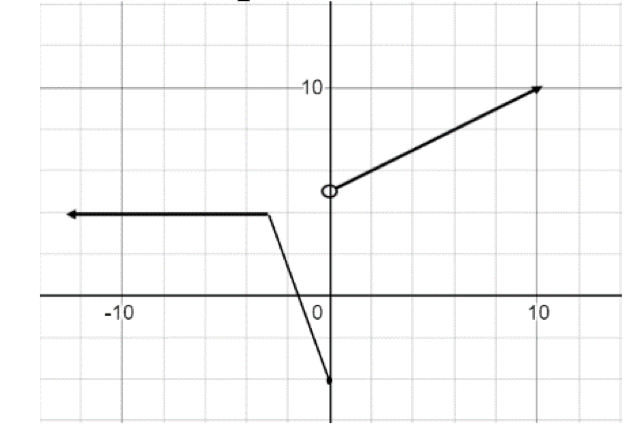
- When graphing piecewise functions, students may forget to put an open circle at the endpoint of a subset function when the endpoint is not included in the domain of the subset function.
- Students may have trouble interpreting the range when the range is not continuous and joins two or more intervals.
Instructional Tasks
Instructional Task 1 (MTR.7.1)- The function below models the height, (), in inches, of water in an aquarium minutes after beginning to fill the aquarium.
- Part A. Graph the function. Be sure to label your graph.
- Part B. Write a story to describe what is happening in your graph.
- Part C. Interpret the domain, range and intercepts of the function in the context of the problem.
- Part D. What will the height of the water be 2 minutes after beginning to fill the aquarium?
Instructional Items
Instructional Item 1- Miami airport offers several different parking options for visitors. A new short term (no more than 24 hours) parking garage charges $1 per hour (or any part thereof) for the first two hours and after that, $3 per hour (or any part thereof) not to exceed $20 per day.
- Part A. Graph the function described above.
- Part B. Interpret the domain and range of the function in the context of the problem.
Related Courses
Related Access Points
Related Resources
Formative Assessments
Lesson Plan
Perspectives Video: Teaching Idea
STEM Lessons - Model Eliciting Activity
In this Model Eliciting Activity, MEA, students use compare and analyze various features of credit cards to choose the best one for a college student. As part of their analysis, students will create step functions to model the interest charged and visually compare interest costs associated with each credit card.
Model Eliciting Activities, MEAs, are open-ended, interdisciplinary problem-solving activities that are meant to reveal students’ thinking about the concepts embedded in realistic situations. MEAs resemble engineering problems and encourage students to create solutions in the form of mathematical and scientific models. Students work in teams to apply their knowledge of science and mathematics to solve an open-ended problem while considering constraints and tradeoffs. Students integrate their ELA skills into MEAs as they are asked to clearly document their thought processes. MEAs follow a problem-based, student-centered approach to learning, where students are encouraged to grapple with the problem while the teacher acts as a facilitator. To learn more about MEAs visit: https://www.cpalms.org/cpalms/mea.aspx
MFAS Formative Assessments
Students are given a graph and a verbal description of a function and are asked to describe its domain.
Students are asked to graph a step function, state the domain of the function, and name any intercepts.

