Please sign in to access this resource
Not a Florida public school educator?
Access this resourceon CPALMS.com
General Information
Aligned Standards
This vetted resource aligns to concepts or skills in these benchmarks.Related Videos

Dr. David McNutt explains how a simple do-it-yourself quadrat and a transect can be used for ecological sampling to estimate population density in a given area.
Download the CPALMS Perspectives video student note taking guide.
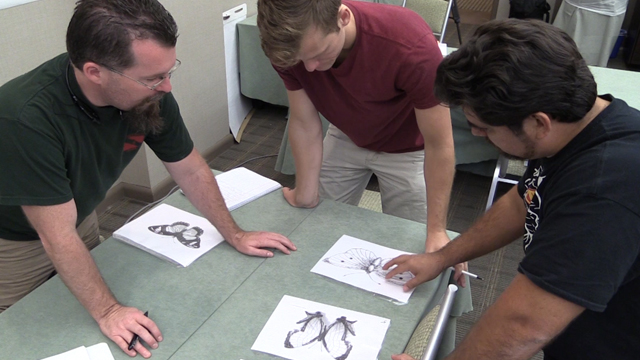
This researcher explains common methods behind randomized studies in the social sciences, specifically in education.

Carbon can take many forms, including foam! Learn more about how geometry and the Monte Carlo Method is important in understanding it.
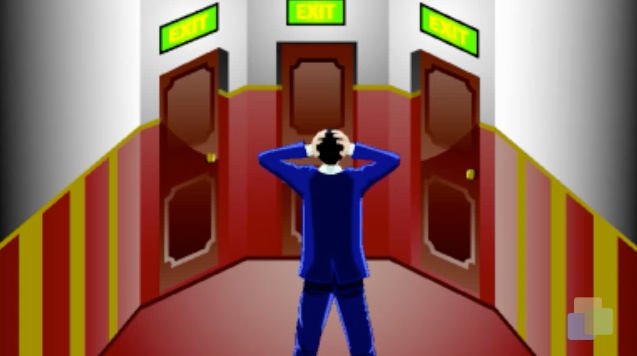
Should I keep my choice or switch? Learn more about the origins and probability behind the Monty Hall door picking dilemma and how Game Theory and strategy effect the probability.
Download the CPALMS Perspectives video student note taking guide.

Florida State University Counseling Psychologist discusses how he uses confidence intervals to make inferences on college students' experiences on campus based on a sample of students.
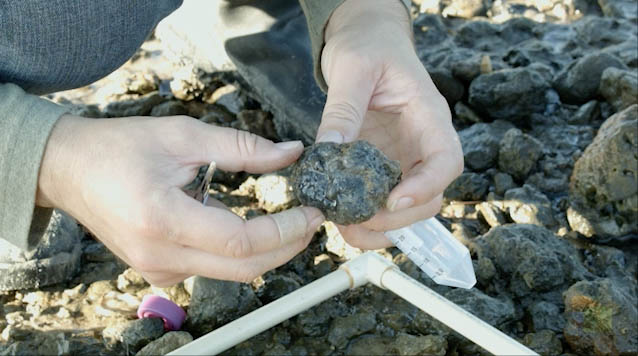
Will Ryan describes methods for collecting multiple random samples of anemones in coastal marine environments.
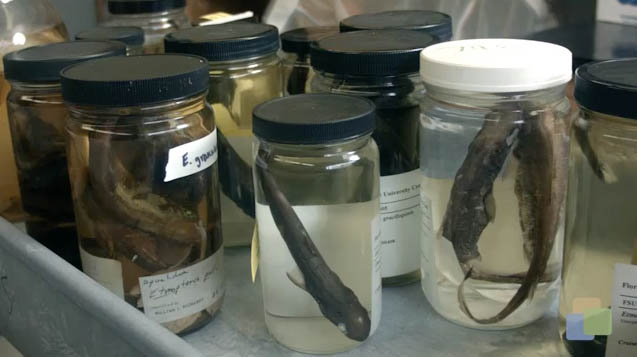
Deep sea shark researcher, Chip Cotton, discusses the need for a Power Analysis to determine the critical sample size in order to make inferences on how oil spills affect shark populations.
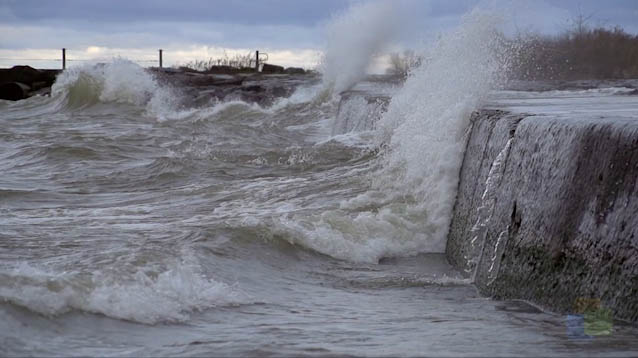
Entrepreneur and meteorologist Mark Powell discusses the need for statistics in his mathematical modeling program to help better understand hurricanes.
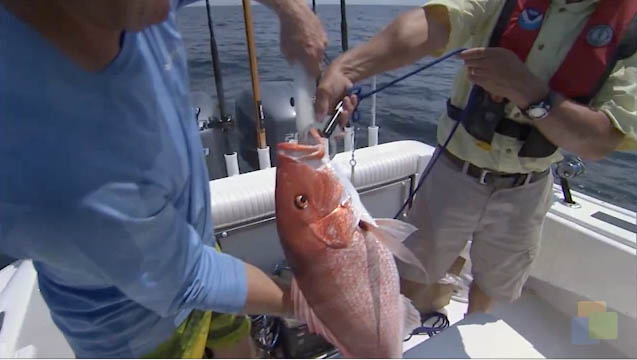
NOAA Scientist Doug Devries discusses the differences between fishery independent surveys and fishery independent surveys. Discussion includes trap sampling as well as camera sampling. Using graphs to show changes in population of red snapper.
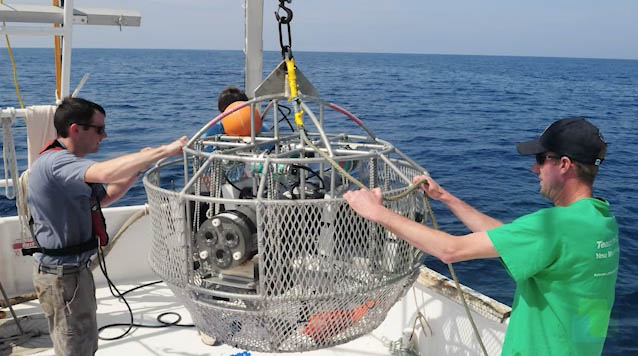
Underwater sampling with cameras has made fishery management more accurate for NOAA scientists.
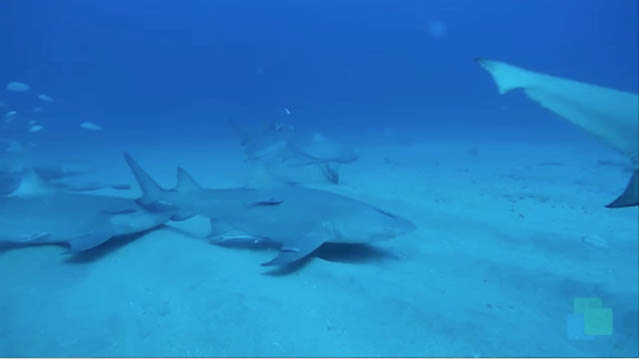
Fish Ecologist, Dean Grubbs, discusses how using statistical sampling can help determine legal catch rates for fish that may be endangered.
Download the CPALMS Perspectives video student note taking guide.
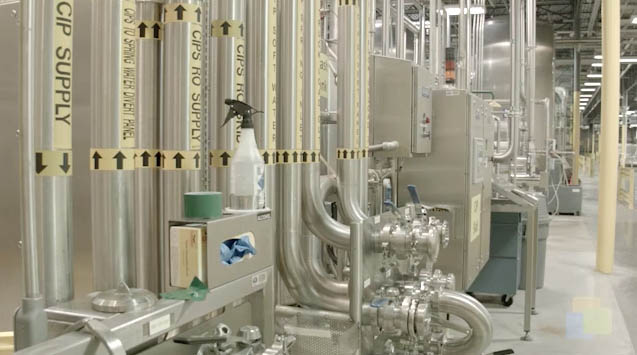
Hydrogeologist from Nestle Waters discusses the importance of statistical tests in monitoring sustainability and in maintaining consistent water quality in bottled water.
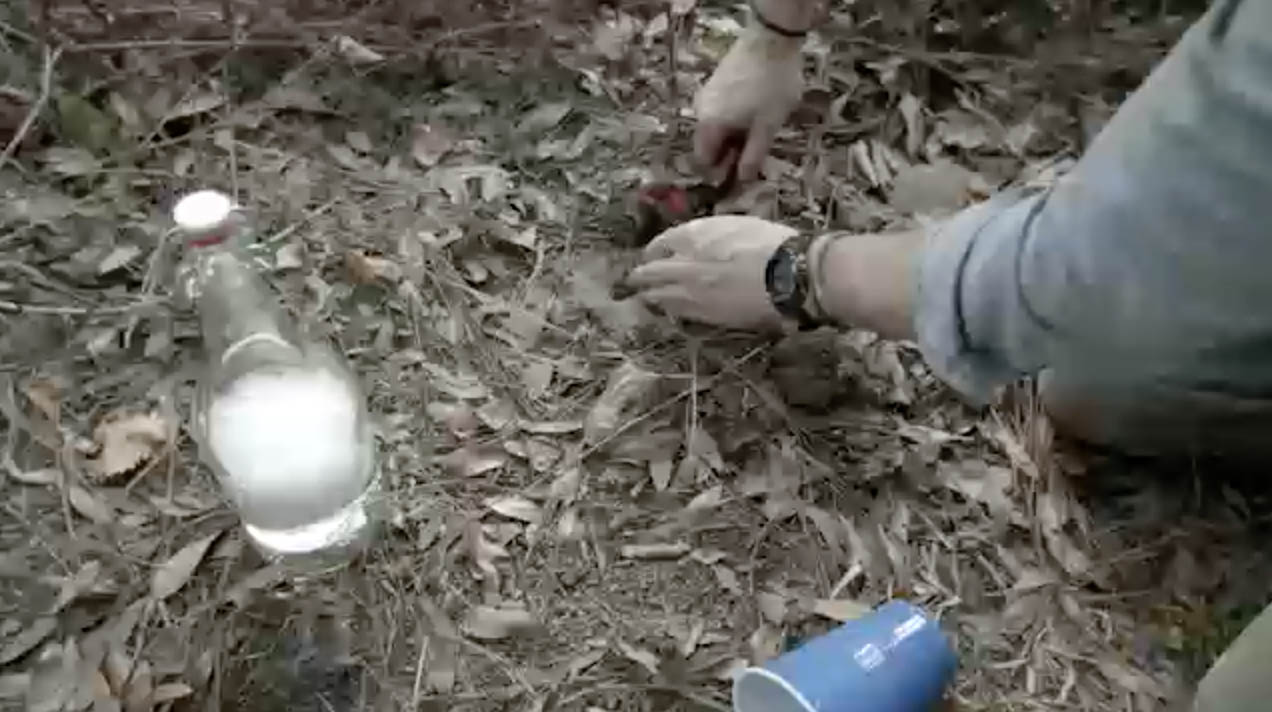
Patrick Milligan shares a teaching idea for collecting insect samples.

Watching this video will cause your critical thinking skills to improve. You might also have a great day, but that's just correlation.
Download the CPALMS Perspectives video student note taking guide.

This marine biologist discusses her use of graphical representations to help determine the most cost-effective management strategies for sea turtle conservation.
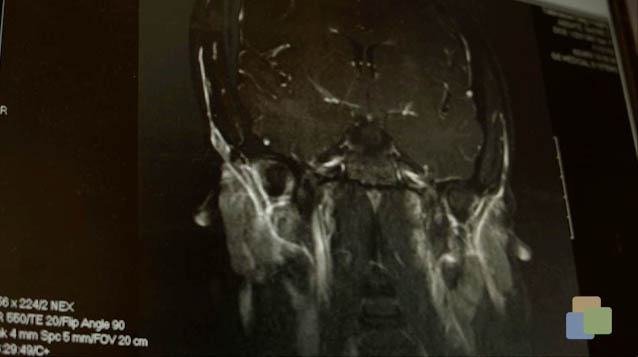
Jens Foell discusses the link between correlation and causation in PTSD patients.
Download the CPALMS Perspectives video student note taking guide.
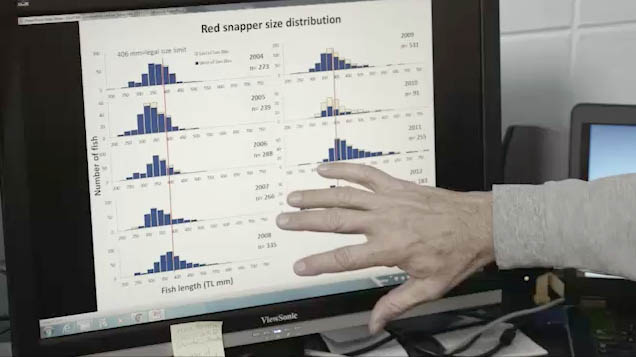
NOAA Fishery management relies on histograms to show patterns and trends over time of fishery data.
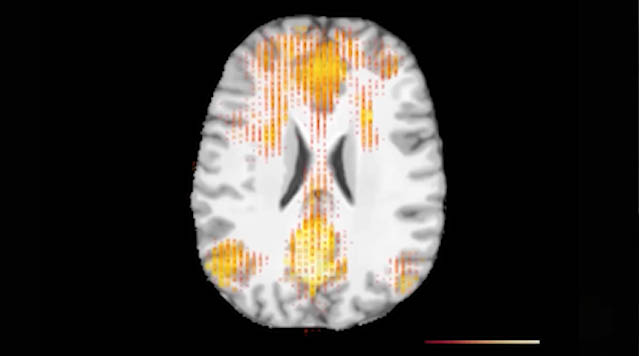
Florida State Researcher, Jens Foell, discusses the importance of understanding correlation versus causation when researching personality traits and criminal behavior.
Download the CPALMS Perspectives video student note taking guide.
![Cpalms [Logo]](/images/cpalms_color.png)


