
General Information
Test Item Specifications
- Interpret a situation and represent the variables mathematically.
- Select appropriate mathematical methods to use.
- Explore the effects of systematically varying the constraints.
- Interpret and evaluate the data generated and identify the break-even point, checking it for confirmation.
- Communicate their reasoning clearly.
Students will solve problems that can be represented by a system of two linear equations.
Students will identify the unique solution for a system of equations representing two intersecting lines.
Students will understand that a specific system of equations representing parallel lines has no solution.
Graphs used in items may include all four quadrants.
Items should rely primarily on tables, graphs, or models to present problems.
Items may assess knowledge of the slopes of lines (including vertical and horizontal lines) and the x- and y-intercepts of lines.
Items may assess properties of parallel or perpendicular lines.
Context or problems should enable students to solve using concrete or pictorial representations of models, tables, and graphs, rather than solve abstractly using algebraic symbolism.
Graphics should be used for all of these items.
Sample Test Items (2)
| Test Item # | Question | Difficulty | Type |
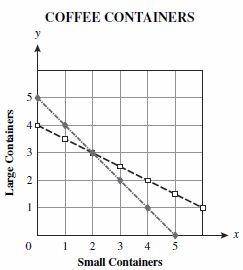
| Sample Item 1 | Caleb is buying small and large containers of coffee. He purchased 5 containers of coffee that weighed a total of 40 pounds. The small containers weigh 5 pounds and the large containers weigh 10 pounds. The equations and graph below can be used to determine the number of each type of container Caleb purchased, where x represents the small container and y represents the large container. Number of containers: x + y = 5 Total weight of coffee: 5x + 10y = 40
|
N/A | MC: Multiple Choice |
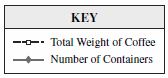
| Sample Item 2 | An economist is helping a paper company evaluate the demand for reams of paper at different selling prices. The point at which the supply and demand graphs intersect is referred to as market equilibrium. The economist graphed the supply and demand equations shown below. Demand equation: y = -0.1x + 12 Supply equation: y = 0.11x - 2.7
What is the price per ream, in dollars, of the market equilibrium? |
N/A | GR: Gridded-Response |
Related Resources
Educational Software / Tool
| Name | Description |
| Free Graph Paper | A variety of graph paper types for printing, including Cartesian, polar, engineering, isometric, logarithmic, hexagonal, probability, and Smith chart. |
Formative Assessment
| Name | Description |
| Solving Real-Life Problems: Baseball Jerseys | This lesson unit is intended to help you assess how well students are able to:
|
Problem-Solving Task
| Name | Description |
| Smiles | In this online problem-solving challenge, students apply algebraic reasoning to determine the "costs" of individual types of faces from sums of frowns, smiles, and neutral faces. This page provides three pictorial problems involving solving systems of equations along with tips for thinking through the problem, the solution, and other similar problems. |
Virtual Manipulative
| Name | Description |
| Multi Bar Graph | This activity allows the user to graph data sets in multiple bar graphs. The color, thickness, and scale of the graph are adjustable which may produce graphs that are misleading. Users may input their own data, or use or alter pre-made data sets. This activity includes supplemental materials, including background information about the topics covered, a description of how to use the application, and exploration questions for use with the java applet. |
Student Resources
Problem-Solving Task
| Name | Description |
| Smiles: | In this online problem-solving challenge, students apply algebraic reasoning to determine the "costs" of individual types of faces from sums of frowns, smiles, and neutral faces. This page provides three pictorial problems involving solving systems of equations along with tips for thinking through the problem, the solution, and other similar problems. |
Virtual Manipulative
| Name | Description |
| Multi Bar Graph: | This activity allows the user to graph data sets in multiple bar graphs. The color, thickness, and scale of the graph are adjustable which may produce graphs that are misleading. Users may input their own data, or use or alter pre-made data sets. This activity includes supplemental materials, including background information about the topics covered, a description of how to use the application, and exploration questions for use with the java applet. |
Parent Resources
Problem-Solving Task
| Name | Description |
| Smiles: | In this online problem-solving challenge, students apply algebraic reasoning to determine the "costs" of individual types of faces from sums of frowns, smiles, and neutral faces. This page provides three pictorial problems involving solving systems of equations along with tips for thinking through the problem, the solution, and other similar problems. |