
General Information
Test Item Specifications
Students will describe the concepts of slope, x-, or y-intercept of a given graph in a real-world situation.
Problems should be solved using concrete or pictorial representations of models, tables, and graphs, rather than solved abstractly using algebraic symbolism.
Functions may be from all four quadrants.
Items should rely primarily on tables, graphs, and t-tables to present real-world relationships.
Equations used in items should include no more than three operations.
Items may include positive, negative, or zero slopes, but not undefined slopes.
The x- and y-intercepts are limited to integers and halves.
Graphics should be used in most of these items, as appropriate.
Items may be set in either a real-world or mathematical context.
Sample Test Items (1)
| Test Item # | Question | Difficulty | Type |
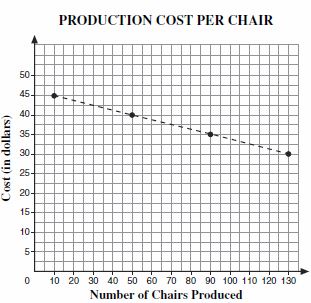
| Sample Item 1 | The production manager of a furniture manufacturing company plotted values on the graph below to show how the production cost per chair decreases as the number of chairs produced increases. The slope of the dashed line segment joining these points is -1/8.
What does this slope of the dashed line segment represent? |
N/A | MC: Multiple Choice |
Related Resources
Educational Software / Tool
| Name | Description |
| Free Graph Paper | A variety of graph paper types for printing, including Cartesian, polar, engineering, isometric, logarithmic, hexagonal, probability, and Smith chart. |
Lesson Plan
| Name | Description |
| Who goes faster, earns more, drives farthest? | Given a proportional relationship, students will determine the constant of proportionality, write an equation, graph the relationship, and interpret in context. |
Teaching Idea
| Name | Description |
| Learning About Rate of Change in Linear Functions Using Interactive Graphs | This resource features two pairs of interactive graphs to help students explore rate of change and linear relationships. "Users can drag a slider on an interactive graph to modify a rate of change (cost per minute for phone use) and learn how modifications in that rate affect the linear graph displaying accumulation (the total cost of calls). In this first part, Constant Cost per Minute, the cost per minute for phone use remains constant over time. In the second part, Changing Cost per Minute, the cost per minute for phone use changes after the first sixty minutes of calls." (from NCTM's Illuminations) |
Parent Resources
Teaching Idea
| Name | Description |
| Learning About Rate of Change in Linear Functions Using Interactive Graphs: | This resource features two pairs of interactive graphs to help students explore rate of change and linear relationships. "Users can drag a slider on an interactive graph to modify a rate of change (cost per minute for phone use) and learn how modifications in that rate affect the linear graph displaying accumulation (the total cost of calls). In this first part, Constant Cost per Minute, the cost per minute for phone use remains constant over time. In the second part, Changing Cost per Minute, the cost per minute for phone use changes after the first sixty minutes of calls." (from NCTM's Illuminations) |