
General Information
Test Item Specifications
Students will find solutions for linear problems by creating or interpreting tables, graphs, or models.
Problems should be solved using concrete or pictorial representations of models, tables, and graphs, rather than solved abstractly using algebraic symbolism.
Students will determine whether the content in the problem uses discrete or continuous data and/or will determine the relevant domain and range.
Equations used in items should include no more than two variables and no more than two operations.
Values in expressions should be rational numbers.
In items that contain equations, the equation must be linear.
Items should be set in a real-world context.
Sample Test Items (1)
| Test Item # | Question | Difficulty | Type |
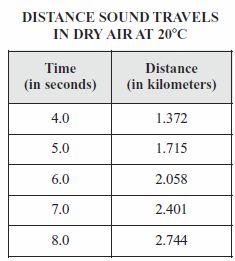
| Sample Item 1 | Sandy conducted an experiment with sound waves in dry air at 20ºC. She observed that a linear relationship exists between the time and distance that sound travels under these conditions. She recorded her findings in the table below.
Based on the information in the table, which of the following is a valid statement about Sandy’s recorded findings? |
N/A | MC: Multiple Choice |
Related Resources
Educational Software / Tool
| Name | Description |
| Free Graph Paper | A variety of graph paper types for printing, including Cartesian, polar, engineering, isometric, logarithmic, hexagonal, probability, and Smith chart. |
Lesson Plan
| Name | Description |
| Who goes faster, earns more, drives farthest? | Given a proportional relationship, students will determine the constant of proportionality, write an equation, graph the relationship, and interpret in context. |
Problem-Solving Task
| Name | Description |
| Drip, Drop, Drip, Drop | Students design an experiment to model a leaky faucet and determine the amount of water wasted due to the leak. Using the data they gather in a table, students graph and write an equation for a line of best fit. Students then use their derived equation to make predictions about the amount of water that would be wasted from one leak over a long period of time or the amount wasted by several leaks during a specific time period. |
Virtual Manipulative
| Name | Description |
| Multi Bar Graph | This activity allows the user to graph data sets in multiple bar graphs. The color, thickness, and scale of the graph are adjustable which may produce graphs that are misleading. Users may input their own data, or use or alter pre-made data sets. This activity includes supplemental materials, including background information about the topics covered, a description of how to use the application, and exploration questions for use with the java applet. |
Student Resources
Virtual Manipulative
| Name | Description |
| Multi Bar Graph: | This activity allows the user to graph data sets in multiple bar graphs. The color, thickness, and scale of the graph are adjustable which may produce graphs that are misleading. Users may input their own data, or use or alter pre-made data sets. This activity includes supplemental materials, including background information about the topics covered, a description of how to use the application, and exploration questions for use with the java applet. |