
General Information
Clusters should not be sorted from Major to Supporting and then taught in that order. To do so would strip the coherence of the mathematical ideas and miss the opportunity to enhance the major work of the grade with the supporting clusters.
Test Item Specifications
- Interpret distance-time graphs as if they are pictures of situations rather than abstract representations of them.
- Have difficulty relating speeds to slopes of these graphs.
- Interpret speed as the slope of a linear graph.
- Translate between the equation of a line and its graphical representation.
- Explore relationships between variables in everyday situations.
- Find unknown values from known values.
- Find relationships between pairs of unknowns, and express these as tables and graphs.
- Find general relationships between several variables, and express these in different ways by rearranging formulae.
Linear or nonlinear relationships may use any of the four quadrants. Graph descriptions move from left to right. Functional relationships must be continuous.
Neutral
Allowable
Sample Test Items (5)
| Test Item # | Question | Difficulty | Type |
| Sample Item 1 | Which graph represents a linear function increasing at a constant rate? |
N/A | MC: Multiple Choice |
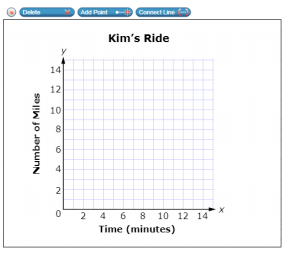
| Sample Item 2 | Kim rides a stationary bike for fifteen minutes of exercise. Kim starts her ride slowly, stops for 2 minutes, and then continues her ride faster than she started. Use the Connect Line tool to create a possible graph of Kim’s ride.
|
N/A | GRID: Graphic Response Item Display |
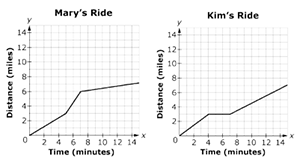
| Sample Item 3 | Mary and Kim go bike riding on some trails. Graphs of the functions representing one of their rides are shown, where x is the time, in minutes, and y is the distance, in miles. Select all statements that are true based on the graphs shown.
|
N/A | MS: Multiselect |
| Sample Item 4 | Mary and Kim ride their bikes to school each day. Graphs of the functions representing one of their rides are shown, where x is the time, in minutes, and y is the distance, in miles.
Write a short story about Mary’s bike ride describing the relationship between time and distance. Include information about changes in the behavior of the function and rate of speed using terms such as increasing, constant, and decreasing. |
N/A | OR: Open Response |
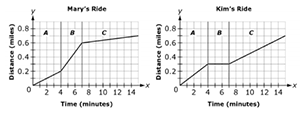
| Sample Item 5 | Mary and Kim each take 15 mintues to ride their bikes to school. The graphs of the functions that model their rides are shown, where x is the time, in minutes, and y is the distance, in miles.
The graphs are divided into time intervals A, B, and C. Use the graphs to match each statement with the appropriate person or people.
|
N/A | MI: Matching Item |

Related Courses
| Course Number1111 | Course Title222 |
| 1205050: | M/J Accelerated Mathematics Grade 7 (Specifically in versions: 2014 - 2015, 2015 - 2020, 2020 - 2022, 2022 - 2024, 2024 and beyond (current)) |
| 1205070: | M/J Grade 8 Pre-Algebra (Specifically in versions: 2014 - 2015, 2015 - 2022, 2022 - 2024, 2024 and beyond (current)) |
| 2002100: | M/J Comprehensive Science 3 (Specifically in versions: 2014 - 2015, 2015 - 2022, 2022 - 2024, 2024 and beyond (current)) |
| 2002110: | M/J Comprehensive Science 3, Advanced (Specifically in versions: 2014 - 2015, 2015 - 2022, 2022 - 2024, 2024 and beyond (current)) |
| 2003010: | M/J Physical Science (Specifically in versions: 2014 - 2015, 2015 - 2022, 2022 - 2024, 2024 and beyond (current)) |
| 2003020: | M/J Physical Science, Advanced (Specifically in versions: 2014 - 2015, 2015 - 2022, 2022 - 2024, 2024 and beyond (current)) |
| 1204000: | M/J Foundational Skills in Mathematics 6-8 (Specifically in versions: 2014 - 2015, 2015 - 2022, 2022 - 2024, 2024 and beyond (current)) |
| 7812030: | Access M/J Grade 8 Pre-Algebra (Specifically in versions: 2014 - 2015, 2015 - 2018, 2018 - 2019, 2019 - 2022, 2022 and beyond (current)) |
| 2002085: | M/J Comprehensive Science 2 Accelerated Honors (Specifically in versions: 2014 - 2015, 2015 - 2022, 2022 - 2024, 2024 and beyond (current)) |
| 2002200: | M/J STEM Environmental Science (Specifically in versions: 2015 - 2022, 2022 - 2024, 2024 and beyond (current)) |
| 2001025: | M/J STEM Astronomy and Space Science (Specifically in versions: 2015 - 2022, 2022 - 2024, 2024 and beyond (current)) |
Related Resources
Educational Software / Tool
| Name | Description |
| Free Graph Paper | A variety of graph paper types for printing, including Cartesian, polar, engineering, isometric, logarithmic, hexagonal, probability, and Smith chart. |
Formative Assessments
| Name | Description |
| Population Trend | Students are asked to describe the relationship between two quantities in a nonlinear function. |
| Jet Fuel | Students are asked to analyze and describe the relationship between two linearly related quantities. |
| Graph the Ride | Students are given a verbal description of the relationship between two quantities and are asked to sketch a graph to model the relationship. |
| Bacterial Growth Graph | Students are given a verbal description of the relationship between two quantities and are asked to sketch a graph to model the relationship. |
| Interpreting Distance-Time Graphs | This lesson unit is intended to help you assess how well students are able to interpret distance-time graphs and, in particular, to help you identify students who:
|
| Lines and Linear Equations | This lesson is intended to help you assess how well students are able to: |
Lesson Plans
| Name | Description |
| Stars: HR Diagram & Classification | In this lesson students will categorize a list of stars based on absolute brightness, size, and temperature. Students will analyze astronomical data presented in charts and plot their data on a special graph called a Hertzsprung-Russell Diagram (H-R Diagram). Using this diagram, they must determine the proper classification of individual stars. Using their data analysis, students completing this lesson will develop two short essay responses to a professional client indicating which stars are Main Sequence Stars and which ones are White Dwarfs, Giants, or Supergiants. |
| Modeling Situations With Linear Equations | This lesson unit is intended to help you assess how well students use algebra in context, and in particular, how well students: |
| Interpreting Distance-Time Graphs | This lesson takes a formative assessment approach to assessing whether students can interpret distance-time graphs. Whole-class discussion, group work, and individual activities help students interpret distance-time graphs related to real-world scenarios. |
| Constructing and Calibrating a Hydrometer | Students construct and calibrate a simple hydrometer using different salt solutions. They then graph their data and determine the density and salinity of an unknown solution using their hydrometer and graphical analysis. |
Original Student Tutorials
| Name | Description |
| Math Models and Social Distancing | Learn how math models can show why social distancing during a epidemic or pandemic is important in this interactive tutorial. |
| Cruising Through Functions | Cruise along as you discover how to qualitatively describe functions in this interactive tutorial. |
Perspectives Video: Expert
| Name | Description |
| Using Mathematics to Optimize Wing Design | Nick Moore discusses his research behind optimizing wing design using inspiration from animals and how they swim and fly. Download the CPALMS Perspectives video student note taking guide. |
Perspectives Video: Professional/Enthusiasts
| Name | Description |
| Asymptotic Behavior in Shark Growth Research | Fishery Scientist from Florida State University discusses his new research in deep sea sharks and the unusual behavior that is found when the data is graphed. Download the CPALMS Perspectives video student note taking guide. |
| KROS Pacific Ocean Kayak Journey: Kites, Wind, and Speed | Lofty ideas about kites helped power a kayak from California to Hawaii. Related Resources: Download the CPALMS Perspectives video student note taking guide. |
Problem-Solving Tasks
| Name | Description |
| Bike Race | The purpose of this task is for students to interpret two distance-time graphs in terms of the context of a bicycle race. There are two major mathematical aspects to this: interpreting what a particular point on the graph means in terms of the context and understanding that the "steepness" of the graph tells us something about how fast the bicyclists are moving. |
| Modeling with a Linear Function | The primary purpose of this task is to elicit common misconceptions that arise when students try to model situations with linear functions. This task, being multiple choice, could also serve as a quick assessment to gauge a class' understanding of modeling with linear functions. |
| Tides | This is a simple task about interpreting the graph of a function in terms of the relationship between quantities that it represents. |
| Riding by the Library | In this task students draw the graphs of two functions from verbal descriptions. Both functions describe the same situation but changing the viewpoint of the observer changes where the function has output value zero. This small twist forces the students to think carefully about the interpretation of the dependent variable. This task could be used in different ways: To generate a class discussion about graphing. As a quick assessment about graphing, for example during a class warm-up. To engage students in small group discussion. |
| Velocity vs. Distance | In this task students interpret two graphs that look the same but show very different quantities. The first graph gives information about how fast a car is moving while the second graph gives information about the position of the car. This problem works well to generate a class or small group discussion. Students learn that graphs tell stories and have to be interpreted by carefully thinking about the quantities shown. |
Student Center Activity
| Name | Description |
| Edcite: Mathematics Grade 8 | Students can practice answering mathematics questions on a variety of topics. With an account, students can save their work and send it to their teacher when complete. |
Teaching Idea
| Name | Description |
| Learning About Rate of Change in Linear Functions Using Interactive Graphs | This resource features two pairs of interactive graphs to help students explore rate of change and linear relationships. "Users can drag a slider on an interactive graph to modify a rate of change (cost per minute for phone use) and learn how modifications in that rate affect the linear graph displaying accumulation (the total cost of calls). In this first part, Constant Cost per Minute, the cost per minute for phone use remains constant over time. In the second part, Changing Cost per Minute, the cost per minute for phone use changes after the first sixty minutes of calls." (from NCTM's Illuminations) |
Tutorials
| Name | Description |
| Comparing linear functions from a graph | In this tutorial, students will compare linear functions from a graph. Students should have an understanding of slope and rate of change before reviewing this tutorial. |
| Compare linear functions from a table and graph | This tutorial shows how to compare linear functions that are presented in both a table and graph. Students should have an understanding of rate of change before viewing this video. |
| Comparing linear functions | Students will compare linear functions presented in a graph and in a table. Students should have a strong understanding of rate of change before viewing this tutorial.
|
| Interpreting Linear Graphs | In this tutorial, you will look at several real-world examples of linear graphs and interpret the relationship between the two variables. |
Unit/Lesson Sequences
| Name | Description |
| Proportional Reasoning | In this resource, a special kind of functional relationship is explored: the proportional relationship. Teachers may find the resource useful for professional development, especially the videos. Students develop proportional reasoning skills by comparing quantities, looking at the relative ways numbers change, and thinking about proportional relationships in linear functions.
This resource has four objectives. Students learn to differentiate between relative and absolute meanings of "more" and determine which of these is a proportional relationship, compare ratios without using common denominator algorithms, differentiate between additive and multiplicative processes and their effects on scale and proportionality, and interpret graphs that represent proportional relationships or direct variation. |
| Direct and Inverse Variation | "Lesson 1 of two lessons teaches students about direct variation by allowing them to explore a simulated oil spill using toilet paper tissues (to represent land) and drops of vegetable oil (to simulate a volume of oil). Lesson 2 teaches students about inverse variation by exploring the relationship between the heights of a fixed amount of water poured into cylindrical containers of different sizes as compared to the area of the containers' bases." from Insights into Algebra 1 - Annenberg Foundation. |
Virtual Manipulatives
| Name | Description |
| Graphing Lines | Allows students access to a Cartesian Coordinate System where linear equations can be graphed and details of the line and the slope can be observed. |
| Function Flyer | In this online tool, students input a function to create a graph where the constants, coefficients, and exponents can be adjusted by slider bars. This tool allows students to explore graphs of functions and how adjusting the numbers in the function affect the graph. Using tabs at the top of the page you can also access supplemental materials, including background information about the topics covered, a description of how to use the application, and exploration questions for use with the java applet. |
| Graphs and Functions | This lesson is designed to introduce students to plotting points and graphing functions in the Cartesian coordinate system. The lesson provides links to discussions and activities that transition from functions as rules to the graphs of those functions. Finally, the lesson provides links to follow-up lessons designed for use in succession to an introduction to graphing. |
| Equation Grapher | This interactive simulation investigates graphing linear and quadratic equations. Users are given the ability to define and change the coefficients and constants in order to observe resulting changes in the graph(s). |
Student Resources
Original Student Tutorials
| Name | Description |
| Math Models and Social Distancing: | Learn how math models can show why social distancing during a epidemic or pandemic is important in this interactive tutorial. |
| Cruising Through Functions: | Cruise along as you discover how to qualitatively describe functions in this interactive tutorial. |
Problem-Solving Tasks
| Name | Description |
| Bike Race: | The purpose of this task is for students to interpret two distance-time graphs in terms of the context of a bicycle race. There are two major mathematical aspects to this: interpreting what a particular point on the graph means in terms of the context and understanding that the "steepness" of the graph tells us something about how fast the bicyclists are moving. |
| Modeling with a Linear Function: | The primary purpose of this task is to elicit common misconceptions that arise when students try to model situations with linear functions. This task, being multiple choice, could also serve as a quick assessment to gauge a class' understanding of modeling with linear functions. |
| Tides: | This is a simple task about interpreting the graph of a function in terms of the relationship between quantities that it represents. |
| Riding by the Library: | In this task students draw the graphs of two functions from verbal descriptions. Both functions describe the same situation but changing the viewpoint of the observer changes where the function has output value zero. This small twist forces the students to think carefully about the interpretation of the dependent variable. This task could be used in different ways: To generate a class discussion about graphing. As a quick assessment about graphing, for example during a class warm-up. To engage students in small group discussion. |
| Velocity vs. Distance: | In this task students interpret two graphs that look the same but show very different quantities. The first graph gives information about how fast a car is moving while the second graph gives information about the position of the car. This problem works well to generate a class or small group discussion. Students learn that graphs tell stories and have to be interpreted by carefully thinking about the quantities shown. |
Student Center Activity
| Name | Description |
| Edcite: Mathematics Grade 8: | Students can practice answering mathematics questions on a variety of topics. With an account, students can save their work and send it to their teacher when complete. |
Tutorials
| Name | Description |
| Comparing linear functions from a graph: | In this tutorial, students will compare linear functions from a graph. Students should have an understanding of slope and rate of change before reviewing this tutorial. |
| Compare linear functions from a table and graph: | This tutorial shows how to compare linear functions that are presented in both a table and graph. Students should have an understanding of rate of change before viewing this video. |
| Comparing linear functions : | Students will compare linear functions presented in a graph and in a table. Students should have a strong understanding of rate of change before viewing this tutorial.
|
| Interpreting Linear Graphs: | In this tutorial, you will look at several real-world examples of linear graphs and interpret the relationship between the two variables. |
Virtual Manipulatives
| Name | Description |
| Graphing Lines: | Allows students access to a Cartesian Coordinate System where linear equations can be graphed and details of the line and the slope can be observed. |
| Function Flyer: | In this online tool, students input a function to create a graph where the constants, coefficients, and exponents can be adjusted by slider bars. This tool allows students to explore graphs of functions and how adjusting the numbers in the function affect the graph. Using tabs at the top of the page you can also access supplemental materials, including background information about the topics covered, a description of how to use the application, and exploration questions for use with the java applet. |
| Equation Grapher: | This interactive simulation investigates graphing linear and quadratic equations. Users are given the ability to define and change the coefficients and constants in order to observe resulting changes in the graph(s). |
Parent Resources
Problem-Solving Tasks
| Name | Description |
| Bike Race: | The purpose of this task is for students to interpret two distance-time graphs in terms of the context of a bicycle race. There are two major mathematical aspects to this: interpreting what a particular point on the graph means in terms of the context and understanding that the "steepness" of the graph tells us something about how fast the bicyclists are moving. |
| Modeling with a Linear Function: | The primary purpose of this task is to elicit common misconceptions that arise when students try to model situations with linear functions. This task, being multiple choice, could also serve as a quick assessment to gauge a class' understanding of modeling with linear functions. |
| Tides: | This is a simple task about interpreting the graph of a function in terms of the relationship between quantities that it represents. |
| Riding by the Library: | In this task students draw the graphs of two functions from verbal descriptions. Both functions describe the same situation but changing the viewpoint of the observer changes where the function has output value zero. This small twist forces the students to think carefully about the interpretation of the dependent variable. This task could be used in different ways: To generate a class discussion about graphing. As a quick assessment about graphing, for example during a class warm-up. To engage students in small group discussion. |
| Velocity vs. Distance: | In this task students interpret two graphs that look the same but show very different quantities. The first graph gives information about how fast a car is moving while the second graph gives information about the position of the car. This problem works well to generate a class or small group discussion. Students learn that graphs tell stories and have to be interpreted by carefully thinking about the quantities shown. |
Teaching Idea
| Name | Description |
| Learning About Rate of Change in Linear Functions Using Interactive Graphs: | This resource features two pairs of interactive graphs to help students explore rate of change and linear relationships. "Users can drag a slider on an interactive graph to modify a rate of change (cost per minute for phone use) and learn how modifications in that rate affect the linear graph displaying accumulation (the total cost of calls). In this first part, Constant Cost per Minute, the cost per minute for phone use remains constant over time. In the second part, Changing Cost per Minute, the cost per minute for phone use changes after the first sixty minutes of calls." (from NCTM's Illuminations) |
Virtual Manipulative
| Name | Description |
| Graphing Lines: | Allows students access to a Cartesian Coordinate System where linear equations can be graphed and details of the line and the slope can be observed. |