
General Information
Test Item Specifications
Students may identify the correct display of a given set of data.
Students will analyze and draw conclusions about data displayed in the form of frequency tables, bar graphs, pictographs, and line plots.
Students will analyze data to supply missing data in frequency tables, bar graphs, pictographs, and line plots.
Items may require the student to choose the most appropriate datadisplay given a set of data from observations, surveys, and/orexperiments.
Items may assess identifying parts of a correct graph and recognizingthe appropriate scale.
The increments used on the scale are limited to units of 1, 2, 5, 10,50, or 100.
Pictographs can use keys containing a scale of 1, 2, 5, or 10.
The data presented in graphs should represent no more than five categories.
The total sample size for bar graphs should be no more than 1,000.
The total sample size should be no more than 200 for frequencytables, pictographs, and line plots.
Addition, subtraction, or multiplication of whole numbers may beused within the item.
Items may be set in a real-world or mathematical context.
Increment grid lines must be shown on graphs.
Graphics will be used in all items.
Sample Test Items (1)
| Test Item # | Question | Difficulty | Type |
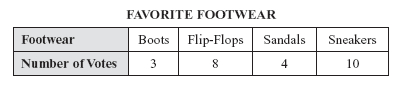
| Sample Item 1 | The students in Mrs. Livingston’s class voted for their favorite kind of footwear. The number of votes are shown on the table below.
|
N/A | MC: Multiple Choice |
Related Resources
Educational Software / Tool
| Name | Description |
| Free Graph Paper | A variety of graph paper types for printing, including Cartesian, polar, engineering, isometric, logarithmic, hexagonal, probability, and Smith chart. |
Lesson Plans
| Name | Description |
| Healthy Habits | In this Model Eliciting Activity, MEA, students will determine what two snacks should be placed in the school vending machines because the district is asking for healthier and tastier snacks. Factors to consider are calories, fat, protein, sugar, student comments, and cost. Model Eliciting Activities, MEAs, are open-ended, interdisciplinary problem-solving activities that are meant to reveal students’ thinking about the concepts embedded in realistic situations. MEAs resemble engineering problems and encourage students to create solutions in the form of mathematical and scientific models. Students work in teams to apply their knowledge of science and mathematics to solve an open-ended problem, while considering constraints and tradeoffs. Students integrate their ELA skills into MEAs as they are asked to clearly document their thought process. MEAs follow a problem-based, student-centered approach to learning, where students are encouraged to grapple with the problem while the teacher acts as a facilitator. To learn more about MEA’s visit: https://www.cpalms.org/cpalms/mea.aspx |
| Dream Skates | In this Model-Eliciting Activity (MEA), a student engineering team is asked by a wheel manufacturer to investigate and develop a plan to select the best model of roller blades. Model Eliciting Activities, MEAs, are open-ended, interdisciplinary problem-solving activities that are meant to reveal students’ thinking about the concepts embedded in realistic situations. MEAs resemble engineering problems and encourage students to create solutions in the form of mathematical and scientific models. Students work in teams to apply their knowledge of science and mathematics to solve an open-ended problem while considering constraints and tradeoffs. Students integrate their ELA skills into MEAs as they are asked to clearly document their thought processes. MEAs follow a problem-based, student-centered approach to learning, where students are encouraged to grapple with the problem while the teacher acts as a facilitator. To learn more about MEAs visit: https://www.cpalms.org/cpalms/mea.aspx |
Teaching Ideas
| Name | Description |
| How Deep Do They Dive-SeaWorld Classroom Activity | In this activity, students relate pictures to mathematical ideas and create a graph. They are given approximate maximum diving depths for five whales and they must determine how to represent this data on a pictograph. |
| Ball Bounce Experiment | Students investigate different balls' abilities to bounce and represent the data they collect graphically. |
| Weather or Not? (NCTM) - Featured for Math and Science Day | These activities give students opportunities to investigate weather conditions that involve reading and recording temperatures, graphing, making charts, solving word problems, and working with numbers.
Used with permission from Teaching Children Mathematics, copyright April 2008 by the National Council of Teachers of Mathematics. All rights reserved. |
| Popcorn Math | This webpage features 8 popcorn-themed math activities that can be used at various grade levels. Topics covered include volume, estimating, graphing, measuring, and place value. |
Virtual Manipulatives
| Name | Description |
| Bar Graph | This lesson is designed to give students experience creating and reading bar graphs. The lesson provides links to a practice data set and the bar graph activity so that students can practice making bar graphs and check their work using the activity. Finally, the lesson provides a suggested follow-up to this lesson. |
| KidsZone: Create a Graph | Create bar, line, pie, area, and xy graphs. |