
General Information
Clusters should not be sorted from Major to Supporting and then taught in that order. To do so would strip the coherence of the mathematical ideas and miss the opportunity to enhance the major work of the grade with the supporting clusters.
Test Item Specifications
Measurement units are limited to halves, quarters, and eighths. Addition and subtraction of fractions is limited to fractions with like denominators. Limit addition and subtraction to solutions within 1,000.
No
Allowable
Sample Test Items (1)
| Test Item # | Question | Difficulty | Type |
| Sample Item 1 | A line plot with long jump data is given.
Allison jumped How far, in feet, did Allison jump? |
N/A | EE: Equation Editor |
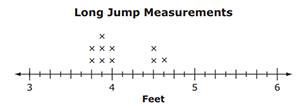
 foot shorter than the farthest jump.
Related Courses
| Course Number1111 | Course Title222 |
| 5012060: | Grade Four Mathematics (Specifically in versions: 2014 - 2015, 2015 - 2022, 2022 - 2024, 2024 and beyond (current)) |
| 5020050: | Science - Grade Four (Specifically in versions: 2014 - 2015, 2015 - 2022, 2022 - 2024, 2024 and beyond (current)) |
| 5021060: | Social Studies Grade 4 (Specifically in versions: 2014 - 2015, 2015 - 2022, 2022 - 2023, 2023 - 2024, 2024 and beyond (current)) |
| 7712050: | Access Mathematics Grade 4 (Specifically in versions: 2014 - 2015, 2015 - 2018, 2018 - 2022, 2022 and beyond (current)) |
| 7720050: | Access Science Grade 4 (Specifically in versions: 2014 - 2015, 2015 - 2018, 2018 - 2023, 2023 and beyond (current)) |
| 5020110: | STEM Lab Grade 4 (Specifically in versions: 2016 - 2022, 2022 - 2024, 2024 and beyond (current)) |
| 5012065: | Grade 4 Accelerated Mathematics (Specifically in versions: 2019 - 2022, 2022 - 2024, 2024 and beyond (current)) |
| 5012015: | Foundational Skills in Mathematics 3-5 (Specifically in versions: 2019 - 2022, 2022 - 2024, 2024 and beyond (current)) |
Related Resources
Formative Assessments
| Name | Description |
| Science Experiment Part Two | Students are asked to analyze data presented in a line plot and solve problems related to the data. |
| Science Experiment Part One | Students are asked to use a given set of data to create a line plot with an appropriate scale. |
| Race Cars Part Two | Students are asked to analyze data presented in a line plot and solve problems related to the data. |
| Race Cars Part One | Students are asked to use a given set of data to create a line plot with an appropriate scale. |
Lesson Plans
| Name | Description |
| Going Green - Renewable and Non-Renewable Florida Resources | Students will use their knowledge of renewable and non-renewable resources to create a green community in Florida. The students will be given a map of a plot of land in Florida on which to develop a green community. They will need to use renewable resources while protecting the non-renewable resources on the plot of land. |
| One Leg Up | In this lesson the students will be using a line plot to display a data set of measurements in fractions of a unit (1/2, 1/4, 1/8). They will be measuring different lengths of insects, recording the lengths, and then plotting the data on a line plot. From this data they will solve problems involving the addition and subtraction of fractions. |
| Marshmallow Math | In this lesson, students are physically engaged in measuring distances of tossed marshmallows to the nearest 1/2 foot. Using their measurements, they will represent the data on a line plot and then solve word problems involving addition and subtraction of mixed numbers. This is a fun lesson that motivates students to become excited about the difficult world of fractions. |
Original Student Tutorial
| Name | Description |
| Logging Lengths with Line Plots | Learn how to create a line plot and analyze data in the line plot in this interactive tutorial. You will also see how to add and subtract using the line plot to solve problems based on the line plots. |
Virtual Manipulative
| Name | Description |
| KidsZone: Create a Graph | Create bar, line, pie, area, and xy graphs. |
Student Resources
Original Student Tutorial
| Name | Description |
| Logging Lengths with Line Plots: | Learn how to create a line plot and analyze data in the line plot in this interactive tutorial. You will also see how to add and subtract using the line plot to solve problems based on the line plots. |