Standard #: MA.912.DP.5.7


This document was generated on CPALMS - www.cpalms.org


Compare and contrast surveys, experiments and observational studies.


Clarifications


Clarification 1: Instruction includes understanding how randomization relates to sample surveys, experiments and observational studies.

General Information

Subject Area: Mathematics (B.E.S.T.)
Grade: 912
Strand: Data Analysis and Probability
Status: State Board Approved

Benchmark Instructional Guide

Connecting Benchmarks/Horizontal Alignment


Terms from the K-12 Glossary

  • Data 
  • Population (in data analysis) 
  • Random sampling 
  • Association 
  • Repeated experiment 
  • Statistical question

Vertical Alignment

Previous Benchmarks

Next Benchmarks

Purpose and Instructional Strategies

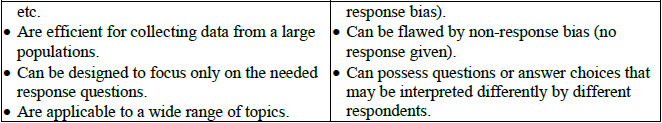
In middle grades, students examined the processes for generating data and performing calculations from data. Students continued these processes to a degree in Algebra I. In Mathematics for College Statistics, students learn to compare and contrast surveys, observations, and experiments. This benchmark has a direct relationship to the benchmark MA.912.DP.5.6
  • Instruction defines a survey to be the set of questions asked to participants. Surveys can be deployed in an observation or an experiment.
    Table
    Table
  • Students should have practice examining and comparing statistical studies; students should examine how participants were selected or organized. If subjects are randomly sampled and all asked the same set of questions, an observational study was utilized. If the study was designed such that participants are randomly assigned to different groups (at least two or more), an experimental study was utilized. 
    Table
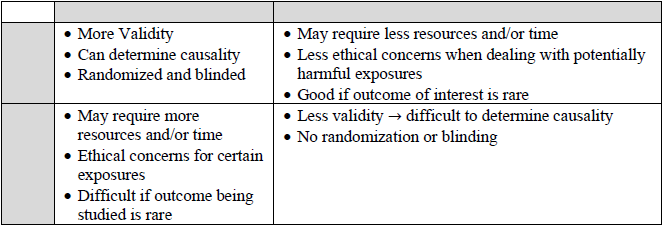
  • For enrichment of this benchmark, different aspects can be discussed with experimental studies, including treatment groups, control groups, placebos, blinding and double-blinding. 
    • A single-blinded experiment is designed so that the participants are not aware of the treatment being administered in the study. A double-blinded experiment is designed so that participants and those collecting data are not aware of the treatment being administered in the study. 
  • As an expectation of this benchmark, students examine different types of studies and decide the conclusion that can be made.
    • For example, if the study is experimental, it is possible to infer a cause and effect relationship between variables. 
    • If the study is observational, do not conclude a causal relationship. Instead, infer that there is a link or an association between variable.
  • Instruction includes emphasizing that observational studies should include random sampling, while experimental studies should include random assignment among the various groups.

Common Misconceptions or Errors

  • Students may initially make incorrect assumptions when determining if a study is an observation or experiment. 
  • Students may have difficulty deciding upon an appropriate conclusion from the statistical study. 
  • Students may believe experiments must use a placebo or have a control group.

Instructional Tasks

Instructional Task 1 (MTR.4.1, MTR.7.1
  • Suppose a nutritionist is interested in the relationship between coffee consumption and a person’s sleeping habits. 
    • Part A. Explain, in detail, how to design a statistical study that could possibly show a link between increased coffee consumption and a decrease in an individual’s average number of hours slept per night. Be sure to include the use of a survey and use proper statistical terminology. 
    • Part B. Explain, in detail, how to design a statistical study that could possibly show increased coffee consumption causes a decrease in an individual’s average number of hours slept per night. Be sure to include the use of a survey and use proper statistical terminology. 
    • Part C. Partner with a classmate to compare and contrast the designs of the two studies above.

Instructional Items

Instructional Item 1 
  • Mr. Artemis is reviewing his students’ grades and their attendance over the course of the school year. He notices that students who miss very few classes have higher grades, and that as students miss more and more classes, their grades tend to decrease. 
    • Part A. Should Mr. Artemis conclude that missing fewer classes will cause students’ grades to increase? Explain why this is or is not an appropriate conclusion. 
    • Part B. Would it be possible (or ethical) to design an experimental study where Mr. Artemis could determine if missing fewer classes will cause students’ grades to increase? Explain.

*The strategies, tasks and items included in the B1G-M are examples and should not be considered comprehensive.


Related Courses

Course Number1111 Course Title222
1210300: Probability and Statistics Honors (Specifically in versions: 2014 - 2015, 2015 - 2019, 2019 - 2022, 2022 - 2024, 2024 and beyond (current))
1210305: Mathematics for College Statistics (Specifically in versions: 2022 - 2024, 2024 and beyond (current))


Related Resources

Lesson Plans

Name Description
To The Limit

"To The Limit" MEA has students identify several factors that can affect a population’s growth. Students will examine photos to list limiting factors and discuss their impact on populations. As a group they will develop a solution to minimize the impact of pollution on fish population.

Model Eliciting Activities, MEAs, are open-ended, interdisciplinary problem-solving activities that are meant to reveal students’ thinking about the concepts embedded in realistic situations. Click here to learn more about MEAs and how they can transform your classroom.

5K and No More - Producing Data

Can your school use $5000? What school doesn't?! Well, the money is available, but the student body must decide how the money will be spent!

5K and No More - Producing Data will enable students to fantasize about what they would do to improve their school if allowed to answer the question, "How would $5000 best be spent at your school?" The activity begins with students distinguishing the differences between a sample survey, an experiment, and an observational study through a pre-activity. After this, the students are given five (5) scenarios in which they must discuss the pros and cons of each. In life we want things to be fair, so students must constantly think about bias. The company in this MEA desires the most efficient and effective way to collect information from the students without having to talk to everyone ... who has that kind of time!

Now, just when the students have found the most efficient and effective way to get students to share their thoughts on where the money should go, more information is revealed about the High School. How do we account for the brains and the brawn, the perfect attendee and the most missed days, or for the goth or skater?

Your Savvy Statisticians in the making will figure it out and tell you ALL about it.

Model Eliciting Activities, MEAs, are open-ended, interdisciplinary problem-solving activities that are meant to reveal students’ thinking about the concepts embedded in realistic situations. MEAs resemble engineering problems and encourage students to create solutions in the form of mathematical and scientific models. Students work in teams to apply their knowledge of science and mathematics to solve an open-ended problem while considering constraints and tradeoffs. Students integrate their ELA skills into MEAs as they are asked to clearly document their thought processes. MEAs follow a problem-based, student-centered approach to learning, where students are encouraged to grapple with the problem while the teacher acts as a facilitator. To learn more about MEAs visit: https://www.cpalms.org/cpalms/mea.aspx

Perspectives Video: Expert

Name Description
PTSD: Correlation vs Causation

Jens Foell discusses the link between correlation and causation in PTSD patients.

Download the CPALMS Perspectives video student note taking guide.

Perspectives Video: Professional/Enthusiast

Name Description
Population Sampling and Beekeeping <p>This buzzworthy video features statistics, sampling, and how scientists make inferences about populations.</p>

Problem-Solving Tasks

Name Description
Sarah, the Chimpanzee

The purpose of this task is to give students experience in using simulation to determine if observed results are consistent with a given model (in this case, the "just guessing" model).

Strict Parents

This task challenges students to describe parameter of interest for the given context, and design a sample survey.

Student Resources

Perspectives Video: Professional/Enthusiast

Name Description
Population Sampling and Beekeeping: <p>This buzzworthy video features statistics, sampling, and how scientists make inferences about populations.</p>


Parent Resources

Perspectives Video: Professional/Enthusiast

Name Description
Population Sampling and Beekeeping: <p>This buzzworthy video features statistics, sampling, and how scientists make inferences about populations.</p>


Printed On:4/26/2025 11:24:52 PM
Print Page | Close this window