
General Information
Subject Area: Mathematics (B.E.S.T.)
Grade: 912
Strand: Data Analysis and Probability
Date Adopted or Revised: 08/20
Status: State Board Approved
Benchmark Instructional Guide
Connecting Benchmarks/Horizontal Alignment
Terms from the K-12 Glossary
- Random sampling
Vertical Alignment
Previous Benchmarks
Next Benchmarks
Purpose and Instructional Strategies
In grade 6, students began writing statistical questions in order to collect data for analysis. This idea continued through the grade levels and courses as students collected data to analyze and plot. In Mathematics for College Statistics, students now look at different sampling methods and the pros and cons of such methods.- Instruction includes the exploration of various sampling methods such as simple random,
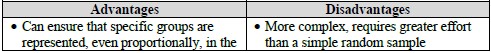
stratified, cluster, systematic, judgement, quota and convenience. There should also be a
discussion of the advantages and disadvantages of each of these sampling methods.
- Simple Random Sample: Simple random sampling is when a sample is selected
in such a way that every possible sample of the same size is equally likely to be chosen from the population.

- Simple Random Sample: Simple random sampling is when a sample is selected
in such a way that every possible sample of the same size is equally likely to be chosen from the population.
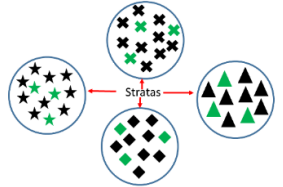
- Stratified: Stratified sampling is a method of sampling that involves the division of a population into smaller sub-groups known as strata. The strata are designed to be homogeneous groups. Then draw a simple random sample from each of these. groups. Samples drawn should be proportional to the size of the strata.
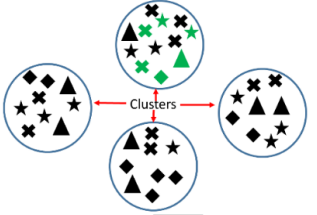
- Cluster: Cluster sampling occurs when a random sample is taken from a group or cluster that people belong to. These clusters should be heterogeneous groups. The clusters is chose using a simple random sample and then a simple random sample is taken from that cluster.

- Systematic: Systematic sampling is where every member of the population is given a number and then a number is chosen randomly from a list as the first participant. After the first participant, there is an interval that is chosen, for example every 15th person, and every 15th person is chosen on the list.

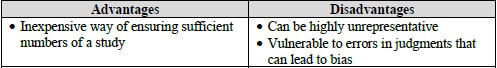
- Judgment: Judgment sampling is where someone uses their own judgment to
select participants from the population of interest.
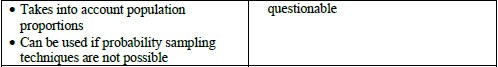
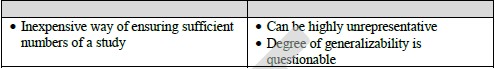
- Quota: Quota sampling is where someone takes a very tailored sample that is in
proportion to some characteristic or trait of a population.
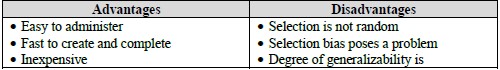
- Convenience: Convenience sampling is when members from a population are
chosen based on what is convenient. For example, a student is interested in
finding out whether students purchase school lunch and asks students who are in
the same classes as they are.
- Instruction includes the discussion of the different biases that may occur with these sampling techniques.
Common Misconceptions or Errors
- Students may confuse stratified sampling and cluster sampling.
- Students may have difficulty in understanding how a random sample can be representative of the population.
Instructional Tasks
Instructional Task 1 (MTR.1.1)- Provide students with a sheet of one hundred random rectangles of various areas. The areas
of these rectangles should be represented using unit squares. Students will be tasked with
estimating the average area of a sample of 5 rectangles using various methods.
- Part A. Provide students with these rectangles on a sheet of paper faced down. Tell students to flip the paper over and study the page for 10 seconds. After 10 seconds, they will then flip the paper back over. Students are then to write down their guess as to what the average area of the rectangles are on the sheet.
- Part B. Now have students select five rectangles that, in their judgment, are representative of the rectangles that appear on the sheet. Have them write these down and find the average area of the five rectangles that they have chosen.
- Part C. Now students will use a random number generator to randomly select five rectangles. Have the students write these five rectangles down and find the average area of the five rectangles that they have chosen.
- Part D. On the board, write down the students averages from Part A, Part B and Part C and then create three graphical representations based on students average areas (Guess, Judgment, Random Sample)
- Describe and compare the three distributions.
- What is the mean for each of these distributions?
- How does these compare to the actual average area?
Instructional Items
Instructional Item 1- A high school is discussing the theme for Homecoming. They want to know what theme the students would be interested in. A student decides to group the students as Freshman, Sophomore, Juniors and Seniors and then take a simple random sample from each of these groups to find out which theme the students would like for Homecoming. What type of sampling technique was used?