General Information
Subject Area: Mathematics (B.E.S.T.)
Grade: 912
Strand: Functions
Date Adopted or Revised: 08/20
Status: State Board Approved
Benchmark Instructional Guide
Connecting Benchmarks/Horizontal Alignment
Terms from the K-12 Glossary
- Exponential Function
- Linear Function
- Quadratic Function
Vertical Alignment
Previous Benchmarks
Next Benchmarks
Purpose and Instructional Strategies
In grade 8, students determined whether a linear relationship is also a proportional relationship. In Algebra I, students determine whether a linear, quadratic or exponential function best models a situation. In later grades, students will fit linear, quadratic, and exponential functions to statistical data.- Instruction should include identifying function types from tables and from written descriptions.
- When examining written descriptions, guide students to see that linear functions model situations in which a quantity changes by a constant amount per unit interval; that quadratic functions model situations in which a quantity increases to a maximum, then begins to decrease or a quantity decreases to a minimum, then begins to increase; and that exponential functions model situations in which a quantity grows or decays by a constant percent per unit interval.
- When considering tables, instruction guides students to understand that linear relationships have a common difference per unit interval (or a constant rate of change), quadratic relationships produce a common second difference, and exponential relationships produce a constant percent rate of change per unit interval (MTR.5.1). It is important to note that using the common second difference method is not an expectation for mastery in Algebra I.
- Considering tables like the one below, lead students to discover that there is a common difference of 0.4 between successive -values. Plotting these points using graphing software will verify that they are collinear.
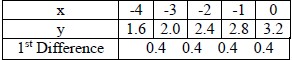
- Considering tables like the one below, lead students to discover that there is a common difference of 0.4 between successive -values. Plotting these points using graphing software will verify that they are collinear.
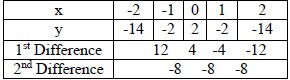
- Considering tables like the one below, lead students to discover that there is a common second difference of -8 between successive -values. Plotting these points using graphing software will verify that they form a parabola.
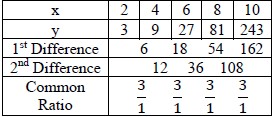
- Considering tables like the one below, lead students to discover that there is no common difference or second difference. In this case, there is a common ratio of
between successive -values. Plotting these points using graphing software will verify that they form an exponential graph.
- Students should note that the search for common differences and ratios only works when the -values are equidistant from each other. Lead them to check for this when presented with tables of values to consider.
- It is important to note that other function types could produce these relationships, making the connection to classifying different function types in MA.912.F.1.1.
Common Misconceptions or Errors
- Students may interpret any relationship that increases/decreases at a non-constant rate as being an exponential relationship. Have these students verify an exponential relationship by looking for common ratios. If they are interpreting a written description, direct them to make a sample table of values from the context to examine.
- Some students may miscalculate first and second differences that deal with negative values, especially if they perform them mentally. In these cases, have students quickly write out the subtraction expression [i.e., −14 – (−2)] so they can see that they are subtracting a negative value and should convert it to adding a positive value.
- It is often helpful to have these students draw a blank number line with a mark for 0 to use for their calculations. Students who solve −14 + 2 to equal −16 could place their pencil tip to the left of 0 on the number line in a position that could represent −14. Ask them which direction they would move to represent adding 2. When students see movement to the right, toward zero, they should understand that the magnitude of the negative number decreases, resulting in −12 rather than −16.
Strategies to Support Tiered Instruction
- Instruction includes verifying an exponential relationship by looking for common ratios. When interpreting a written description, make a sample table of values from the context to examine the type of function.
- Teacher co-creates a graphic organizer to compare exponential and quadratic functions.
- For example, a Venn Diagram can be used with the common middle section including the non-constant rate of change.
- Teacher provides opportunities to write out subtraction sentences next to each line of the table when determining first and second differences.
Instructional Tasks
Instructional Task 1 (MTR.4.1, MTR.7.1)- A scientist is monitoring cell division and notes that a single cell divides into 4 cells within one hour. During the next hour, each of these cells divides into 4 cells. This process continues at the same rate every hour.
- Part A. What type of function could be used to represent this situation?
- Part B. Justify your reasoning.
Instructional Items
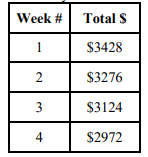
Instructional Item 1- Sarah is spending the summer at her grandmother’s house. The table below shows the amount of money in her bank account at the end of each week. What type of function could be used to model the total amount of money in Sarah’s bank account as a function of time?