
 , where b is a whole number greater than 1 or a unit fraction, or
  , where
  .
.General Information
Subject Area: Mathematics (B.E.S.T.)
Grade: 912
Strand: Algebraic Reasoning
Standard: Write, solve and graph exponential and logarithmic equations and functions in one and two variables.
Date Adopted or Revised: 08/20
Status: State Board Approved
Benchmark Instructional Guide
Connecting Benchmarks/Horizontal Alignment
Terms from the K-12 Glossary
- Exponential
Vertical Alignment
Previous Benchmarks
Next Benchmarks
Purpose and Instructional Strategies
In middle grades, students solved problems involving percentages, including percent increases and decreases and write equations that represent proportional relationships. In Algebra I, students write exponential functions that model relationships characterized by having a constant percent of change per unit interval. In later courses, students will further develop their understanding of this feature of exponential functions.
- Provide opportunities to reference MA.912.AR.1.1 as students identify and interpret parts of an exponential equation or expression as growth or decay and connect them to key features of the graph.
- Problems include cases where the initial value is not given.
- Instruction includes guidance on how to determine the initial value or the percent rate of
change of an exponential function when it is not provided.
- For example, if the initial value of (0,3) is given, students can now write the function as () = 3 . Guide students to choose a point on the curve that has integer coordinates such as (2, 12). Lead them to substitute the point into their function to find . Students should recognize that exponential functions are restricted to positive values of , leading to the function () = 3(2) .
- Instruction includes interpreting percentages of growth/decay from exponential functions
expressed in the form () = and see that can be used to determine a percentage.
- For example, the function () = 500(0.72)x represents 16% growth of an
initial value.
- Guide students to discuss the meaning of the number 1.16 as a percent. They should understand it represents 116%. Taking 116% of an initial value increases the magnitude of that value. (Students can test this in a calculator to confirm.) Taking this percentage repetitively leads to exponential growth.
- For example, the function () = 500(0.72) represents 28% decay of an initial
value.
- Guide students to discuss the meaning of the number 0.72 as a percent. They should understand it represents 72%. Taking 72% of an initial value decreases the magnitude of that value. (Students can test this in a calculator to confirm.) Taking this percentage repetitively leads to exponential decay.
- For example, the function () = 500(1) represents an initial value that neither
grows nor decays as increases.
- Guide students to discuss the meaning of the number 1 when it comes to growth/decay factors. They should understand it represents 100%. Taking 100% of an initial value causes the value to remain the same. (Students can test this in a calculator to confirm.) Taking this percentage repetitively leads to no change in the initial value (explaining the horizontal line that shows when = 1 on the graph).
- For example, the function () = 500(0.72)x represents 16% growth of an
initial value.
Common Misconceptions or Errors
- Students may not understand that exponential function values will eventually get larger than those of any other polynomial functions because they do not fully understand the impact of exponents on a value.
Strategies to Support Tiered Instruction
- Teacher provides students with a graphic displaying key terms within an exponential function.

- Instruction includes comparing quadratic (polynomial) to exponential functions using graphs or tables with whole-number inputs to show how exponential functions will quickly exceed quadratic (polynomial) functions.
Instructional Tasks
Instructional Task 1 (MTR.4.1, MTR.5.1, MTR.7.1)- Karl and Simone were working on separate biology experiments. Each student documented
their cell population counts over time in the chart below.
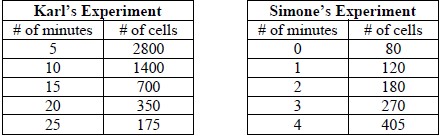
- Part A. Do the number of cells in Simone’s experiment increase at a constant percentage rate of change? If so, what is the percentage rate? If not, describe what is happening to the number of cells. Does this change represent growth or decay? Justify your answer.
- Part B. Write exponential functions to represent the relationship between the quantities for each student’s experiment. In which experiment are the number of cells changing more rapidly? Justify your answer.
- Part C. Graph these functions and determine their key features.
Instructional Task 2 (MTR.2.1, MTR.7.1)
- The population of J-Town in 2019 was estimated to be 76,500 people with an annual rate of
increase of 2.4%.
- Part A. Write an equation to model future growth.
- Part B. What is the growth factor for J-Town?
- Part C. Use the equation to estimate the population in 2072 to the nearest hundred people.
Instructional Items
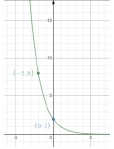
Instructional Item 1- Write an exponential function that represents the graph below.
Instructional Item 2
- A forester has determined that the number of fir trees in a forest is decreasing by 3% per year. In 2010, there were 13,000 fir trees in the forest. Write an equation that represents the number of fir trees, , in terms of , the number of years since 2010.
*The strategies, tasks and items included in the B1G-M are examples and should not be considered comprehensive.