Given a table, equation or written description of a quadratic function, graph that function, and determine and interpret its key features.
Clarifications
Clarification 1: Key features are limited to domain; range; intercepts; intervals where the function is increasing, decreasing, positive or negative; end behavior; vertex; and symmetry.
Clarification 2: Instruction includes the use of standard form, factored form and vertex form, and sketching a graph using the zeros and vertex.
Clarification 3: Instruction includes representing the domain and range with inequality notation, interval notation or set-builder notation.
Clarification 4: Within the Algebra 1 course, notations for domain and range are limited to inequality and set-builder.
Subject Area: Mathematics (B.E.S.T.)
Grade: 912
Strand: Algebraic Reasoning
Date Adopted or Revised: 08/20
Status: State Board Approved
Benchmark Instructional Guide
Connecting Benchmarks/Horizontal Alignment
Terms from the K-12 Glossary
- Coordinate Plane
- Domain
- Function Notation
- Quadratic Function
- Range
- -intercept
- -intercept
Vertical Alignment
Previous Benchmarks
Next Benchmarks
Purpose and Instructional Strategies
In grade 8, students graphed linear two-variable equations given a table, written description or
equation. In Algebra I, students graph quadratic functions given this same kind of information.
In later courses, this work expands to other families of functions.
- Instruction includes conversations about interpreting -intercepts; intervals where the
function is increasing, decreasing, positive or negative; end behavior; and symmetry.
- When discussing end behavior, students should see a relationship between the sign of '' and the end behavior the function exhibits. Instruction presents students with the equation
of a function first, before showing its graph and asking them to predict its end behavior
(MTR.5.1).
- Depending on the form the function is presented in, students may be able to
predict other features as well (MTR.5.1).
- Instruction includes making connections to various forms of quadratic equations to show
their equivalency. Students should understand and interpret when one form might be
more useful than other depending on the context.
- Standard Form Can be described by the equation y= ax2 + bx+c, where a,b and c are any
rational number. This form can be useful when identifying the y-intercept.
- Factored form
Can be described by the equation ( − 1) ( − 2), where 1 and 2 are real
numbers and the roots, or -intercepts. This form can be useful when identifying
the -intercepts, or roots.
- Vertex form
Can be described by the equation =( − )2 + , where the point (, ) is
the vertex. This form can be useful when identifying the vertex.
- Instruction includes the use of - notation and function notation.
- Instruction includes representing domain and range using words, inequality notation and
set-builder notation.
- Words: If the domain is all real numbers, it can be written as “all real numbers” or “any
value of , such that is a real number.”
- Inequality notation: If the domain is all values of greater than 2, it can be represented as > 2.
- Set-builder notation: If the domain is all values of less than or equal to zero, it can be represented as
{| ≤ 0} and is read as “all values of such that is less than or equal to zero.”
- Instruction includes the use of appropriately scaled coordinate planes, including the use
of breaks in the - or -axis when necessary.
Common Misconceptions or Errors
- When describing intervals where functions are increasing, decreasing, positive or
negative, students may represent their interval using the incorrect variable. In these cases,
ask reflective questions to help students examine the meaning of the domain and range in
the problem.
- Students may miss the need for compound inequalities in their intervals. In these cases,
refer to the graph of the function to help them discover areas in their interval that would
not make sense in context.
Strategies to Support Tiered Instruction
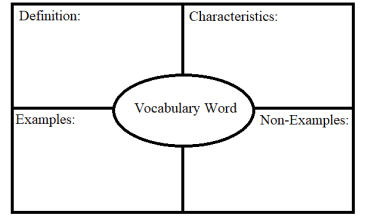
- Teacher provides the opportunity to complete a graphic organizer to compare related key
features.
- For example, students can compare domain versus range, increasing versus
decreasing or positive versus negative.
- Instruction includes modeling how to sketch the graph of the function to determine where
the graph is increasing or decreasing. Students must understand that graphs are read left
to right.
- Instruction includes reflective questions to examine the meaning of the domain and range
in the problem.
- For example, students can ask why the range does not contain all real numbers if
the domain does contain all real numbers.
- For example, students can ask how the vertex relates to the domain and range.
- Instruction references the graph of the function to help discover areas in compound
inequality intervals that would not make sense in context.
- Teacher provides a graphic organizer for key features (vertex; symmetry; end behavior;
intercepts) which can be completed using information provided in a given problem.

- Teacher provides a picture of a parabola (ensure the vertex and zeros are visible) and
labels the parabola with a few of the key features. Then, teacher instructs students to
label the parabola with the remaining key features.
- For example, label the parabola with the coordinates of the vertex, axis of
symmetry, minimum or maximum and zeros.
Instructional Tasks
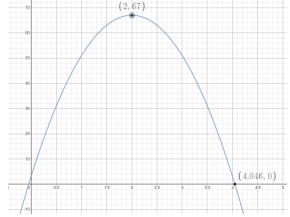
Instructional Task 1 (MTR.3.1, MTR.7.1) - A punter kicks a football to the opposing team. The trajectory of the football can be modeled
by the function () = −162+ 64 + 3 where () represents the height of the football at
any point in time (in seconds), . A graph of the function is below.

- Part A. Determine the meaning of the -intercept in this context.
- Part B. How high did the punt go?
- Part C. Over what interval was the football increasing in height? When was the height
decreasing?
- Part D. What domain and range of this function is appropriate for the context?
Instructional Task 2 (MTR.6.1, MTR.7.1) - A company plans to build a large multiplex theater. The financial analyst told her manager
that the profit function for their theater was () = −2+ 48 −512, where is the
number of movie screens, and () is the profit earned in thousands of dollars.
- Part A. Determine the range of production of movie screens that will guarantee that the
company will not lose money.
- Part B. What is the optimal number of movie screens the theater should have?
Instructional Items
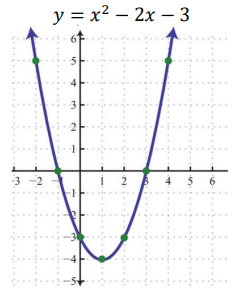
Instructional Item 1 - Graph the function () = 2+ 2 − 3. Identify the domain, range, vertex and zeros of the
function.
*The strategies, tasks and items included in the B1G-M are examples and should not be considered comprehensive.
Related Courses
| Course Number1111 |
Course Title222 |
| 1200310: | Algebra 1 (Specifically in versions: 2014 - 2015, 2015 - 2022, 2022 - 2024, 2024 and beyond (current)) |
| 1200320: | Algebra 1 Honors (Specifically in versions: 2014 - 2015, 2015 - 2022, 2022 - 2024, 2024 and beyond (current)) |
| 1200380: | Algebra 1-B (Specifically in versions: 2014 - 2015, 2015 - 2022, 2022 - 2024, 2024 and beyond (current)) |
| 1200400: | Foundational Skills in Mathematics 9-12 (Specifically in versions: 2014 - 2015, 2015 - 2022, 2022 - 2024, 2024 and beyond (current)) |
| 7912090: | Access Algebra 1B (Specifically in versions: 2014 - 2015, 2015 - 2018, 2018 - 2019, 2019 - 2022, 2022 and beyond (current)) |
| 1200315: | Algebra 1 for Credit Recovery (Specifically in versions: 2014 - 2015, 2015 - 2022, 2022 - 2024, 2024 and beyond (current)) |
| 1200385: | Algebra 1-B for Credit Recovery (Specifically in versions: 2014 - 2015, 2015 - 2022, 2022 - 2024, 2024 and beyond (current)) |
| 7912075: | Access Algebra 1 (Specifically in versions: 2014 - 2015, 2015 - 2018, 2018 - 2019, 2019 - 2022, 2022 and beyond (current)) |
| 1200710: | Mathematics for College Algebra (Specifically in versions: 2022 - 2024, 2024 and beyond (current)) |
| 1209315: | Mathematics for ACT and SAT (Specifically in versions: 2022 - 2024, 2024 and beyond (current)) |
Related Access Points
| Access Point Number |
Access Point Title |
| MA.912.AR.3.AP.7 | Given a table, equation or written description of a quadratic function, select the graph that represents the function. |
Related Resources
Formative Assessment
| Name |
Description |
| Graphing a Quadratic Function | Students are asked to graph a quadratic function and answer questions about the intercepts, maximum, and minimum. |
Lesson Plans
| Name |
Description |
| Discovering Properties of Parabolas by Comparing and Contrasting Parabolic Equations |
- Teachers can use this resource to teach students how to derive the equation of a parabola in vertex form y = a(x – h)2 + k, when given the (x, y) coordinates of the focus and the linear equation of the directrix.
- An additional interactive graphing spreadsheet can be used as a resource to aid teachers in providing examples.
|
| Acting Out A Parabola: the importance of a vertex and directrix | Students will learn the significance of a parabola's vertex and directrix. They will learn the meaning of what exactly a parabola is by physically representing a parabola, vertex, and directrix. Students will be able to write an equation of a parabola given only a vertex and directrix. |
| How High Can I Go? | Students will graph quadratic equations, and identify the axis of symmetry, the maximum/minimum point, the vertex, and the roots. Students will work in pairs and will move around the room matching equations with given graphs. |
| Parts and more Parts-- Parabola Fun | This is an entry lesson into quadratic functions and their shapes. Students see some real-life representations of parabolas. This lesson provides important vocabulary associated with quadratic functions and their graphs in an interactive manner. Students create a foldable and complete a worksheet using their foldable notes. |
| Graphing Quadratics Made Easy: Vertex Form of the Equation | This lesson covers quadratic translations as they relate to vertex form of a quadratic equation. Students will predict what will happen to the graph of a quadratic function when more than one constant is in a quadratic equation. Then, the students will graph quadratic equations in vertex form using their knowledge of the translations of a quadratic function, as well as describe the translations that occur. Students will also identify the parent function of any quadratic function as  . . |
Original Student Tutorial
| Name |
Description |
| Quadratic Functions Part 1: Ball Games | Join us as we watch ball games and explore how the height of a ball bounce over time is represented by quadratic functions, which provides opportunities to interpret key features of the function in this interactive tutorial.
This is part 1 of a two-part series: Click HERE to open part 2. |
Perspectives Video: Expert
Tutorials
| Name |
Description |
| Graphing Quadractic Functions in Vertex Form | This tutorial will help the students to identify the vertex of a parabola from the equation, and then graph the parabola. |
| Graphing Quadratic Equations | This tutorial helps the learners to graph the equation of a quadratic function using the coordinates of the vertex of a parabola and its x- intercepts. |
Student Resources
Original Student Tutorial
| Name |
Description |
| Quadratic Functions Part 1: Ball Games: | Join us as we watch ball games and explore how the height of a ball bounce over time is represented by quadratic functions, which provides opportunities to interpret key features of the function in this interactive tutorial.
This is part 1 of a two-part series: Click HERE to open part 2. |
Tutorials


 .
.