General Information
Benchmark Instructional Guide
Connecting Benchmarks/Horizontal Alignment
Terms from the K-12 Glossary
- Coordinate Plane
- Linear Expression
Vertical Alignment
Previous Benchmarks
Next Benchmarks
Purpose and Instructional Strategies
In grade 8, students graphed linear two-variable equations. In Algebra I, students graph the solution set to a two-variable linear inequality. In later courses, students will solve problems involving linear programming and will graph the solutions sets of two-variable quadratic inequalities.- Instruction includes the use of linear inequalities in standard form, slope-intercept form and point-slope form. Include examples in which one variable has a coefficient of zero such as < −.
- Instruction includes the connection to graphing solution sets of one-variable inequalities on a number line; recognizing whether the boundary line should be dotted (exclusive) or solid (inclusive). Additionally, have students use a test point to confirm which side of the line should be shaded (MTR.6.1).
- Students should recognize that the inequality symbol only directs where the line is shaded (above or below) for inequalities when in slope-intercept form. Students shading inequalities in other forms will need to use a test point to determine the correct half-plane to shade.
Common Misconceptions or Errors
- Students often choose to shade the wrong half-plane when graphing two-variable linear inequalities.
- Students may think that the inequality symbol’s orientation always determines the side of
the line to shade.
- For example, students may say that inequalities with a less than symbol should be shaded below the line while inequalities with a greater than symbol should be shaded above the line. This typically happens after graphing multiple inequalities in slope-intercept form. To address this, provides counterexamples to this such as 3 − 2 < 15 − 4 − 7 ≥ . Use these counterexamples to emphasize the benefit of using a test point to confirm the direction of shading.
Strategies to Support Tiered Instruction
- Instruction includes opportunities to use a highlighter to identify the phrases “is less than,” “is greater than,” “is less than or equal to,” and “is greater than or equal to” when writing inequalities.
- Teacher provides instruction modeling how to correctly identify the solution set of a linear inequality given in slope-intercept form. After graphing, students can circle the y intercept. If the inequality is in form < + or ≤ + , the solution set is the half-plane that contains the -axis values below the -intercept. If the inequality is in form > + or ≥ + , the solution set is the half-plane that contains the - axis values above the -intercept.
- Instruction includes opportunities to graph the boundary line of a system of inequalities, based on an inaccurate translation from word problem. To assist in determining the boundary line for the system, students can create a graphic organizer like the one below.

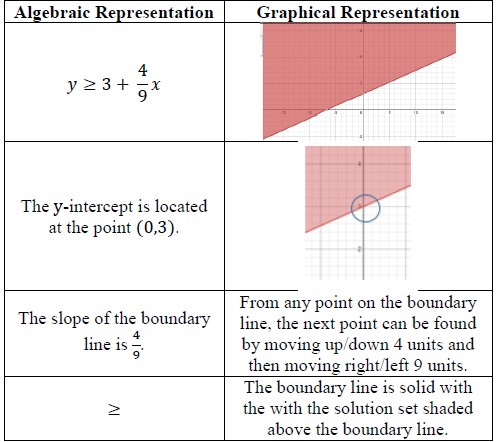
- Instruction includes making the connection between the algebraic and graphical
representations of a two-variable linear inequality and its key features.
- For example, teacher can provide a graphic organizer such as the one below.

- Instruction includes opportunities to identify a test point to plug into an inequality. It is
usually easiest to use the origin (0,0) as it makes mental calculations easier. If the point
selected creates a true statement, their inequality is true and they should shade in the half-plane containing that point. If it creates a false statement, they should shade in the half-plane not containing that point. By using a test point, students avoid the mistake of
thinking that the direction of the inequality determines the shading.
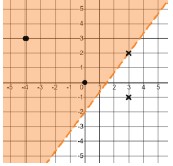
- For example, the points (−4,3), (0,0), (3,2) and (3, −1) were used to determine where to shade for the inequality 4 − 3 < 6 shown below.

Instructional Tasks
Instructional Task 1 (MTR.7.1)- Penelope is planning to bake cakes and cookies to sell for an upcoming school fundraiser.
- Each cake requires 1 cups of flour and each batch of cookies requires 2 cups of flour.
- Penelope bought 3 bags of flour. Each bag contains around 17 cups of flour.
- Part A. Assuming she has all the other ingredients needed, create a graph to show all the possible combinations of cakes and batches of cookies Penelope could make.
- Part B. Create constraints for this given situation.
Instructional Items
Instructional Item 1- Graph the solution set to the inequality + 3 > −2( − 2).
