
General Information
Subject Area: Mathematics (B.E.S.T.)
Grade: 8
Strand: Functions
Standard: Define, evaluate and compare functions.
Date Adopted or Revised: 08/20
Status: State Board Approved
Benchmark Instructional Guide
Connecting Benchmarks/Horizontal Alignment
Terms from the K-12 Glossary
- Domain
- Function
- Range
Vertical Alignment
Previous Benchmarks
Next Benchmarks
Purpose and Instructional Strategies
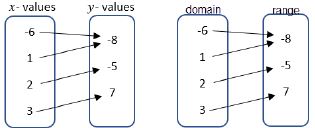
In grade 7, students determined whether two quantities have a proportional relationship by examining a table, graph or written description and they determined the constant of proportionality. In grade 8, students work with linear equations with two variables and begin the introduction of functions. In Algebra 1, students will classify the function type and represent it using function notation.- A mapping diagram consists of a list of -values and their corresponding -values shown with an arrow.
- An example of a mapping diagram can include domain and range values or - and -values.
- An example of a mapping diagram can include domain and range values or - and -values.
- The “vertical line test” should be treated with caution because (1) it allows you to apply a rule without thinking and (2) it may create misconceptions for later mathematics.
- Vocabulary is important in this benchmark as it connects to future learning related to domain and range.
- Students should explain how they verified if the given context was a function or non-function (MTR.4.1). Students should provide counterexamples to deepen their knowledge of the relationships in functions.
- For example, students can be asked to create - and -values that create relations that are functions and non-functions.
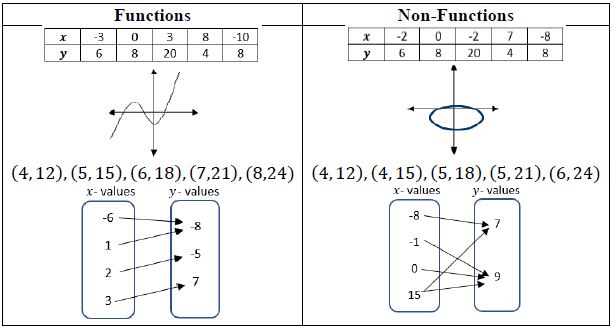
- For example, students can be asked to create - and -values that create relations that are functions and non-functions.
- Domain and range can be shown as a list, an inequality or as a verbal description depending on how the relation is given. The inequalities can be represented as inclusive or non-inclusive as determined by the context.
- For example, if a graph represents a real-world context, with non-negative values, with the equation = 6 + 5, the domain and range can be described as below.
- List
A list cannot be used to represent this relation because it has infinitely many values. - Inequality
Domain: ≥ 0; Range: ≥ 5 - Verbal Description
The domain is all real numbers that are greater than or equal to zero. The range is all real numbers that are greater than or equal to five.
- List
- For example, for the relation {(4, 12), (5, 15), (6, 18), (7,21), (8,24)}, the domain and range can be described as below.
- List
Domain: {4, 5, 6, 7, 8}; Range: {12, 15, 18, 21, 24} - Inequality
An inequality, such as 4 ≤ ≤ 8, cannot be used to represent this relation because it is based on a discrete set of values. - Verbal Description
The domain is all whole numbers from four to eight, inclusive. The range is the multiples of three from 12 to 24, inclusive.
- List
- For example, if a graph represents a real-world context, with non-negative values, with the equation = 6 + 5, the domain and range can be described as below.
Common Misconceptions or Errors
- Students may invert the terms independent and dependent variable. To address this misconception, focus on the vocabulary and relationship to the input and output.
Strategies to Support Tiered Instruction
- Teacher reviews vocabulary and the difference between the terms. Once students understand that independent variables represent the input of the relation, they can make sense of real-world problems to accurately identify independent and dependent variables.
- For example, in a scientific experiment one can determine that input as the variable that is controlled by the scientist. So the independent variable is the one that is controlled in the experiment and the dependent is the result of the experiment.
- Teacher creates a matching activity with real-world situations. Students match dependent variable and the independent variable for the situation. Teacher facilitates discussion among students on their reasoning behind their matches from the activity in order to clear up any lingering misconceptions.
- Instruction includes helping students see how no number within the domain is repeated when the relationship is a function.
Instructional Tasks
Instructional Task 1 (MTR.4.1)A relation is shown below where represents the independent variable and represents the dependent variable.
(3, 4), (−2, 3), (7, 1), (− , 4) , (−2, )
- Part A. Create a mapping diagram, table and graph to represent this relation.
- Part B. Determine the domain and range of the relation.
- Part C. Determine if the relation represents a function or does not represent a function and justify your decision.
- Part D. If the relation is not a function, which point could be removed to make it a function? If it is a function, add a point that would no longer make it a function.
Instructional Items
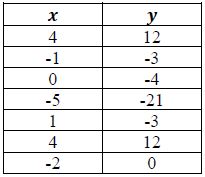
Instructional Item 1A relation is shown in the table below where represents the independent variable and ?? represents the dependent variable. Decide whether the table can represent a function or cannot represent a function.
Instructional Item 2
Identify the domain and range for the relation {(3, 8), (2, 3), (1, 0), (0, −1), (−1, 0)}.
*The strategies, tasks and items included in the B1G-M are examples and should not be considered comprehensive.