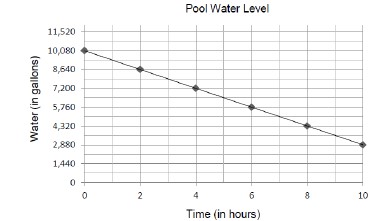
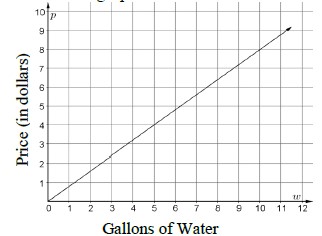
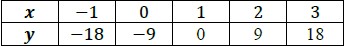
Given a table, graph or written description of a linear relationship, determine the slope.
Problem types include cases where two points are given to determine the slope.
| Name |
Description |
| Compacting Cardboard | Students investigate the amount of space that could be saved by flattening cardboard boxes. The analysis includes linear graphs and regression analysis along with discussions of slope and a direct variation phenomenon. |
| Home Lines | Students will create an outline of a room and write equations of the lines that contain the sides of the room. This lesson provides an opportunity to review and reinforce writing equations of lines (including horizontal and vertical lines) and to apply the relationship between the slopes of parallel and perpendicular lines. |
| A Day at the Park | In this activity, students investigate a set of bivariate data to determine if there is a relationship between concession sales in the park and temperature. Students will construct a scatter plot, model the relationship with a linear function, write the equation of the function, and use it to make predictions about values of variables. |
| You Can Plot it! Bivariate Data | Students create scatter plots, calculate a regression equation using technology, and interpret the slope and y-intercept of the equation in the context of the data. This review lesson relates graphical and algebraic representations of bivariate data. |
| Basketball - it's a tall man's sport - or is it? | The students will use NBA player data to determine if there is a correlation between the height of a basketball player and his free throw percentage. The students will use technology to create scatter plots, find the regression line and calculate the correlation coefficient.
Basketball is a tall man's sport in most regards. Shooting, rebounding, blocking shots - the taller player seems to have the advantage. But is that still true when shooting free throws? |
| Triangle Mid-Segment Theorem | The Triangle Mid-Segment Theorem is used to show the writing of a coordinate proof clearly and concisely. |
| Pondering Points Proves Puzzling Polygons | In a 55 minute class, students use whiteboards, Think-Pair-Share questioning, listen to a quadrilateral song, and work individually and in groups to learn about and gain fluency in using the distance and slope formulas to prove specific polygon types. |
| Scatter Plots | This lesson is an introduction to scatterplots and how to use a trend line to make predictions. Students should have some knowledge of graphing bivariate data prior to this lesson. |
| Hand Me Your Data | Students will gather and use data to calculate a line of fit and the correlation coefficient with their classmates' height and hand size. They will use their line of fit to make approximations. |
| Fit Your Function | Students will make a scatter plot and then create a line of fit for the data. From their graph, students will make predictions and describe relationships between the variables. Students will make predictions, inquire, and formulate ideas from observations and discussions. |
| Beginning Linear Functions | This lesson is designed to introduce students to the concept of slope. Students will be able to:
- determine positive, negative, zero, and undefined slopes by looking at graphed functions.
- determine x- and y-intercepts by substitution, or by examining graphs.
- write equations in slope-intercept form and make graphs based on slope/y-intercept of linear functions.
|
| Scatter Plots and Correlations | Students create scatter plots, and lines of fit, and then calculate the correlation coefficient. Students analyze the results and make predictions. This lesson includes step-by-step directions for calculating the correlation coefficient using Excel, GeoGebra, and a TI-84 Plus graphing calculator. Students will make predictions for the number of views of a video for any given number of weeks on the charts. |
| What's Slope got to do with it? | Students will interpret the meaning of slope and y-intercept in a wide variety of examples of real-world situations modeled by linear functions. |
| Cat Got Your Tongue? | This lesson uses real-world examples to practice interpreting the slope and y-intercept of a linear model in the context of data. Students will collect data, graph a scatter plot, and use spaghetti to identify a line of fit. A PowerPoint is included for guidance throughout the lesson and guided notes are also provided for students. |
| Fundamental Property of Reflections | This lesson helps students discover that in a reflection, the line of reflection is the perpendicular bisector of any segment connecting any pre-image point with its reflected image. |
| If the line fits, where's it? | In this lesson students learn how to informally determine a "best fit" line for a scatter plot by considering the idea of closeness. |
| Doggie Data: It's a Dog's Life | Students use real-world data to construct and interpret scatter plots using technology. Students will create a scatter plot with a line of fit and a function. They describe the relationship of bivariate data. They recognize and interpret the slope and y-intercept of the line of fit within the context of the data. |
| Scrambled Coefficient | Students will learn how the correlation coefficient is used to determine the strength of relationships among real data. Students use card sorting to order situations from negative to positive correlations. Students will create a scatter plot and use technology to calculate the line of fit and the correlation coefficient. Students will make a prediction and then use the line of fit and the correlation coefficient to confirm or deny their prediction.
Students will learn how to use the Linear Regression feature of a graphing calculator to determine the line of fit and the correlation coefficient.
The lesson includes the guided card sorting task, a formative assessment, and a summative assessment. |
| Slippery Slopes | This lesson will not only reinforce students understanding of slope and y-intercept, but will also ensure the students understand how it can be modeled in a real world situation. The focus of this lesson is to emphasize that slope is a rate of change and the y-intercept the value of y when x is zero. Students will be able to read a problem and create a linear equation based upon what they read. They will then make predictions based upon this information. |
| Slope and y-Intercept of a Statistical Model | Students will sketch and interpret the line of fit and then describe the correlation of the data. Students will determine if there’s a correlation between foot size and height by collecting data. |
| Line of Fit | Students will graph scatterplots and draw a line of fit. Next, students will write an equation for the line and use it to interpret the slope and y-intercept in context. Students will also use the graph and the equation to make predictions. |
| An Introduction to Functions: How Much Are Playoff Tickets? | This lesson introduces functions with the real-world example of the cost of tickets for a playoff game. Also, students will determine if tables, graphs, or sets of ordered pairs represent linear functions and explain their reasoning. |
| Getting Graphic with Linear Functions | Students will determine whether a function defined by a graph or an equation is a linear function, determine the rates of change and initial value from a table and graph, as well as be able to interpret what the rate of change means as it relates to a situation. |
| The Linear Function Connection | The students will compare two linear functions that have been represented in different ways (equation, table, graph, verbal description). They will be able to find and compare the rate of change, or slope, of the function from any of the representations. |
| In the Real World | This resource provides a Lesson Plan for teaching students how to analyze real-world problems to look for clearly identified values and determine which of them is a constant value and which of them is subject to change (will increase or decrease per unit of time, weight, length, etc.). The students will also be taught how to determine the correct units for each value in an equation written in slope-intercept form. |
| Designing a Skateboard Kicker Ramp | In this lesson students will design a "Skateboard Kicker Ramp" to discover that slope of similar triangles is the same at any two distinct points. Students will model with mathematics the concept of slope by looking at the pattern set by similar triangles. |
| Graphing Equations on the Cartesian Plane: Slope | The lesson teaches students about an important characteristic of lines: their slope. Slope can be determined either in graphical or algebraic form. Slope can also be described as positive, negative, zero, or undefined. Students get an explanation of when and how these different types of slopes occur. Finally, students learn how slope relates to parallel and perpendicular lines. When two lines are parallel, they have the same slope and when they are perpendicular their slopes are negative reciprocals of one another.
Prerequisite knowledge: Students must know how to graph points on the Cartesian plane. They must be familiar with the x- and y-axis on the plane in both the positive and negative directions. |
| Movie Theater MEA | In this Model Eliciting Activity, MEA, students create a plan for a movie theater to stay in business. Data is provided for students to determine the best film to show, and then based on that decision, create a model of ideal sales. Students will create equations and graph them to visually represent the relationships.
Model Eliciting Activities, MEAs, are open-ended, interdisciplinary problem-solving activities that are meant to reveal students’ thinking about the concepts embedded in realistic situations. Click here to learn more about MEAs and how they can transform your classroom. |
| Scatter plots, spaghetti, and predicting the future | Students will construct a scatter plot from given data. They will identify the correlation, sketch an approximate line of fit, and determine an equation for the line of fit. They will explain the meaning of the slope and y-intercept in the context of the data and use the line of fit to interpolate and extrapolate values. |
| What's the Going Rate? | Students discover that the unit rate and the slope of a line are the same, and these can be used to compare two different proportional relationships. Students compare proportional relationships presented in table and graph form. |
| Who goes faster, earns more, drives farthest? | Given a proportional relationship, students will determine the constant of proportionality, write an equation, graph the relationship, and interpret in context. |
| Name |
Description |
| DVD Profits, Variation 1 | In this task, students are asked to determine the unit price of a product under two different circumstances. They are also asked to generalize the cost of producing x items in each case. |
| High School Graduation | This task provides a unique application of modeling with mathematics. Also, students often think that time must always be the independent variable and so may need some help understanding that one chooses the independent and dependent variable based on the way one wants to view a situation. |
| Sore Throats, Variation 2 | Students graph proportional relationships and understand the unit rate as a measure of the steepness of the related line, called the slope. Students will also treat slopes more formally when they graph proportional relationships and interpret the unit rate as the slope of the graph. |
| Who Has the Best Job? | This task asks the student to graph and compare two proportional relationships and interpret the unit rate as the slope of the graph. Students are also asked to write an equation and graph each scenario. |
| Coffee by the Pound | Students will answer questions about unit price of coffee, make a graph of the information, and explain the meaning of constant of proportionality/slope in the given context. |
| Baseball Cards | This task could be put to good use in an instructional sequence designed to develop knowledge related to students' understanding of linear functions in contexts. Though students could work independently on the task, collaboration with peers is more likely to result in the exploration of a range of interpretations. |
| Battery Charging | This task has students engaging in a simple modeling exercise, taking verbal and numerical descriptions of battery life as a function of time and writing down linear models for these quantities. To draw conclusions about the quantities, students have to find a common way of describing them. |
| Modeling with a Linear Function | The primary purpose of this task is to elicit common misconceptions that arise when students try to model situations with linear functions. This task, being multiple choice, could also serve as a quick assessment to gauge a class' understanding of modeling with linear functions. |
| Downhill | This task would be especially well-suited for instructional purposes. Students will benefit from a class discussion about the slope, y-intercept, x-intercept, and implications of the restricted domain for interpreting more precisely what the equation is modeling. |
| Is This a Rectangle? | The goal of this task is to provide an opportunity for students to apply a wide range of ideas from geometry and algebra in order to show that a given quadrilateral is a rectangle. Creativity will be essential here as the only given information is the Cartesian coordinates of the quadrilateral's vertices. Using this information to show that the four angles are right angles will require some auxiliary constructions. Students will need ample time and, for some of the methods provided below, guidance. The reward of going through this task thoroughly should justify the effort because it provides students an opportunity to see multiple geometric and algebraic constructions unified to achieve a common purpose. The teacher may wish to have students first brainstorm for methods of showing that a quadrilateral is rectangle (before presenting them with the explicit coordinates of the rectangle for this problem): ideally, they can then divide into groups and get to work straightaway once presented with the coordinates of the quadrilateral for this problem. |
| Comparing Speeds in Graphs and Equations | This task provides the opportunity for students to reason about graphs, slopes, and rates without having a scale on the axes or an equation to represent the graphs. Students who prefer to work with specific numbers can write in scales on the axes to help them get started. |
| Chicken and Steak, Variation 1 | In this problem-solving task students are challenged to apply their understanding of linear relationships to determine the amount of chicken and steak needed for a barbecue, which will include creating an equation, sketching a graph, and interpreting both. This resource also includes annotated solutions. |
| Kimi and Jordan | Students are asked to create and graph linear equations to compare the savings of two individuals. The purpose of the table in (a) is to help students complete (b) by noticing regularity in the repeated reasoning required to complete the table. |
| Peaches and Plums | This task asks students to reason about the relative costs per pound of two fruits without actually knowing what the costs are. Students who find this difficult may add a scale to the graph and reason about the meanings of the ordered pairs. Comparing the two approaches in a class discussion can be a profitable way to help students make sense of slope. |
| Video Streaming | Construct a function to model a linear relationship between two quantities. Determine the rate of change and initial value of the function from a description of a relationship or from two (x,y) values, including reading these from a table or from a graph. Interpret the rate of change and initial value of a linear function in terms of the situation it models, and in terms of its graph or a table of values. |
| Chicken and Steak, Variation 2 | In this problem-solving task students are challenged to apply their understanding of linear relationships to determine the amount of chicken and steak needed for a barbecue, which will include creating an equation, sketching a graph, and interpreting both. This resource also includes annotated solutions. |
| Delivering the Mail | This problem-solving task involves constructing a linear function and interpreting its parameters in a mail delivery context. It includes annotated solutions. |
| Distance Across the Channel | This problem-solving task asks students to find a linear function that models something in the real world. After finding the equation of the linear relationship between the depth of the water and the distance across the channel, students have to verbalize the meaning of the slope and intercept of the line in the context of this situation. Commentary and illustrated solutions are included. |
| Equations of Lines | This task asks the student to understand the relationship between slope and changes in x- and y-values of a linear function. |
| Find the Change | This activity challenges students to recognize the relationship between slope and the difference in x- and y-values of a linear function. Help students solidify their understanding of linear functions and push them to be more fluent in their reasoning about slope and y-intercepts. This task has also produced a reasonable starting place for discussing point-slope form of a linear equation. |
| Name |
Description |
| DVD Profits, Variation 1: | In this task, students are asked to determine the unit price of a product under two different circumstances. They are also asked to generalize the cost of producing x items in each case. |
| Who Has the Best Job?: | This task asks the student to graph and compare two proportional relationships and interpret the unit rate as the slope of the graph. Students are also asked to write an equation and graph each scenario. |
| Coffee by the Pound: | Students will answer questions about unit price of coffee, make a graph of the information, and explain the meaning of constant of proportionality/slope in the given context. |
| Modeling with a Linear Function: | The primary purpose of this task is to elicit common misconceptions that arise when students try to model situations with linear functions. This task, being multiple choice, could also serve as a quick assessment to gauge a class' understanding of modeling with linear functions. |
| Downhill: | This task would be especially well-suited for instructional purposes. Students will benefit from a class discussion about the slope, y-intercept, x-intercept, and implications of the restricted domain for interpreting more precisely what the equation is modeling. |
| Is This a Rectangle?: | The goal of this task is to provide an opportunity for students to apply a wide range of ideas from geometry and algebra in order to show that a given quadrilateral is a rectangle. Creativity will be essential here as the only given information is the Cartesian coordinates of the quadrilateral's vertices. Using this information to show that the four angles are right angles will require some auxiliary constructions. Students will need ample time and, for some of the methods provided below, guidance. The reward of going through this task thoroughly should justify the effort because it provides students an opportunity to see multiple geometric and algebraic constructions unified to achieve a common purpose. The teacher may wish to have students first brainstorm for methods of showing that a quadrilateral is rectangle (before presenting them with the explicit coordinates of the rectangle for this problem): ideally, they can then divide into groups and get to work straightaway once presented with the coordinates of the quadrilateral for this problem. |
| Comparing Speeds in Graphs and Equations: | This task provides the opportunity for students to reason about graphs, slopes, and rates without having a scale on the axes or an equation to represent the graphs. Students who prefer to work with specific numbers can write in scales on the axes to help them get started. |
| Chicken and Steak, Variation 1: | In this problem-solving task students are challenged to apply their understanding of linear relationships to determine the amount of chicken and steak needed for a barbecue, which will include creating an equation, sketching a graph, and interpreting both. This resource also includes annotated solutions. |
| Kimi and Jordan: | Students are asked to create and graph linear equations to compare the savings of two individuals. The purpose of the table in (a) is to help students complete (b) by noticing regularity in the repeated reasoning required to complete the table. |
| Peaches and Plums: | This task asks students to reason about the relative costs per pound of two fruits without actually knowing what the costs are. Students who find this difficult may add a scale to the graph and reason about the meanings of the ordered pairs. Comparing the two approaches in a class discussion can be a profitable way to help students make sense of slope. |
| Video Streaming: | Construct a function to model a linear relationship between two quantities. Determine the rate of change and initial value of the function from a description of a relationship or from two (x,y) values, including reading these from a table or from a graph. Interpret the rate of change and initial value of a linear function in terms of the situation it models, and in terms of its graph or a table of values. |
| Chicken and Steak, Variation 2: | In this problem-solving task students are challenged to apply their understanding of linear relationships to determine the amount of chicken and steak needed for a barbecue, which will include creating an equation, sketching a graph, and interpreting both. This resource also includes annotated solutions. |
| Distance Across the Channel: | This problem-solving task asks students to find a linear function that models something in the real world. After finding the equation of the linear relationship between the depth of the water and the distance across the channel, students have to verbalize the meaning of the slope and intercept of the line in the context of this situation. Commentary and illustrated solutions are included. |
| Equations of Lines: | This task asks the student to understand the relationship between slope and changes in x- and y-values of a linear function. |
| Find the Change: | This activity challenges students to recognize the relationship between slope and the difference in x- and y-values of a linear function. Help students solidify their understanding of linear functions and push them to be more fluent in their reasoning about slope and y-intercepts. This task has also produced a reasonable starting place for discussing point-slope form of a linear equation. |
| Name |
Description |
| DVD Profits, Variation 1: | In this task, students are asked to determine the unit price of a product under two different circumstances. They are also asked to generalize the cost of producing x items in each case. |
| High School Graduation: | This task provides a unique application of modeling with mathematics. Also, students often think that time must always be the independent variable and so may need some help understanding that one chooses the independent and dependent variable based on the way one wants to view a situation. |
| Sore Throats, Variation 2: | Students graph proportional relationships and understand the unit rate as a measure of the steepness of the related line, called the slope. Students will also treat slopes more formally when they graph proportional relationships and interpret the unit rate as the slope of the graph. |
| Who Has the Best Job?: | This task asks the student to graph and compare two proportional relationships and interpret the unit rate as the slope of the graph. Students are also asked to write an equation and graph each scenario. |
| Coffee by the Pound: | Students will answer questions about unit price of coffee, make a graph of the information, and explain the meaning of constant of proportionality/slope in the given context. |
| Baseball Cards: | This task could be put to good use in an instructional sequence designed to develop knowledge related to students' understanding of linear functions in contexts. Though students could work independently on the task, collaboration with peers is more likely to result in the exploration of a range of interpretations. |
| Battery Charging: | This task has students engaging in a simple modeling exercise, taking verbal and numerical descriptions of battery life as a function of time and writing down linear models for these quantities. To draw conclusions about the quantities, students have to find a common way of describing them. |
| Modeling with a Linear Function: | The primary purpose of this task is to elicit common misconceptions that arise when students try to model situations with linear functions. This task, being multiple choice, could also serve as a quick assessment to gauge a class' understanding of modeling with linear functions. |
| Downhill: | This task would be especially well-suited for instructional purposes. Students will benefit from a class discussion about the slope, y-intercept, x-intercept, and implications of the restricted domain for interpreting more precisely what the equation is modeling. |
| Is This a Rectangle?: | The goal of this task is to provide an opportunity for students to apply a wide range of ideas from geometry and algebra in order to show that a given quadrilateral is a rectangle. Creativity will be essential here as the only given information is the Cartesian coordinates of the quadrilateral's vertices. Using this information to show that the four angles are right angles will require some auxiliary constructions. Students will need ample time and, for some of the methods provided below, guidance. The reward of going through this task thoroughly should justify the effort because it provides students an opportunity to see multiple geometric and algebraic constructions unified to achieve a common purpose. The teacher may wish to have students first brainstorm for methods of showing that a quadrilateral is rectangle (before presenting them with the explicit coordinates of the rectangle for this problem): ideally, they can then divide into groups and get to work straightaway once presented with the coordinates of the quadrilateral for this problem. |
| Comparing Speeds in Graphs and Equations: | This task provides the opportunity for students to reason about graphs, slopes, and rates without having a scale on the axes or an equation to represent the graphs. Students who prefer to work with specific numbers can write in scales on the axes to help them get started. |
| Chicken and Steak, Variation 1: | In this problem-solving task students are challenged to apply their understanding of linear relationships to determine the amount of chicken and steak needed for a barbecue, which will include creating an equation, sketching a graph, and interpreting both. This resource also includes annotated solutions. |
| Kimi and Jordan: | Students are asked to create and graph linear equations to compare the savings of two individuals. The purpose of the table in (a) is to help students complete (b) by noticing regularity in the repeated reasoning required to complete the table. |
| Peaches and Plums: | This task asks students to reason about the relative costs per pound of two fruits without actually knowing what the costs are. Students who find this difficult may add a scale to the graph and reason about the meanings of the ordered pairs. Comparing the two approaches in a class discussion can be a profitable way to help students make sense of slope. |
| Video Streaming: | Construct a function to model a linear relationship between two quantities. Determine the rate of change and initial value of the function from a description of a relationship or from two (x,y) values, including reading these from a table or from a graph. Interpret the rate of change and initial value of a linear function in terms of the situation it models, and in terms of its graph or a table of values. |
| Chicken and Steak, Variation 2: | In this problem-solving task students are challenged to apply their understanding of linear relationships to determine the amount of chicken and steak needed for a barbecue, which will include creating an equation, sketching a graph, and interpreting both. This resource also includes annotated solutions. |
| Distance Across the Channel: | This problem-solving task asks students to find a linear function that models something in the real world. After finding the equation of the linear relationship between the depth of the water and the distance across the channel, students have to verbalize the meaning of the slope and intercept of the line in the context of this situation. Commentary and illustrated solutions are included. |
| Equations of Lines: | This task asks the student to understand the relationship between slope and changes in x- and y-values of a linear function. |
| Find the Change: | This activity challenges students to recognize the relationship between slope and the difference in x- and y-values of a linear function. Help students solidify their understanding of linear functions and push them to be more fluent in their reasoning about slope and y-intercepts. This task has also produced a reasonable starting place for discussing point-slope form of a linear equation. |

 , where (1, 1) and (2, 2) are two different points on the line.