
General Information
Subject Area: Mathematics (B.E.S.T.)
Grade: 7
Strand: Geometric Reasoning
Date Adopted or Revised: 08/20
Status: State Board Approved
Benchmark Instructional Guide
Connecting Benchmarks/Horizontal Alignment
Terms from the K-12 Glossary
- Area
- Constant of Proportionality
- Scale Factor
Vertical Alignment
Previous Benchmarks
Next Benchmarks
Purpose and Instructional Strategies
In grade 6, students solved problems relating to the perimeter or area of a rectangle as well as the area of composite figures by decomposing them into triangles or rectangles. In grade 7, students solve mathematical and real-world problems involving dimensions and areas of geometric figures, including scale drawings and scale factors. In grade 8, students will continue to work with scale factor and apply it to dilations before moving to high school and determining how dilations affect the area of two-dimensional figures and the surface area or volume of three-dimensional figures.- Scale drawings of geometric figures connect proportionality to geometry, which leads to future work in similarity and congruence. Initially, students explore scale drawings as an enlargement or reduction of one object to obtain a similar object by using a scale factor. Begin with whole number measurements, progressing to rational numbers as students deepen their understanding.
- Instruction focuses on seeing the scale factor as a constant of proportionality between corresponding lengths in the scale drawing and the original object. Use manipulatives such as Geoboards/pegboards, dot paper, centimeter grid paper, etc. to enlarge and reduce shapes by simple scale factors (MTR.2.1). Discuss whether multiplication or division may be used, reminding students that division can be represented by multiplication, and reinforcing that multiplication by a factor between 0 and 1 will be a reduction in size.
- Geoboards
green square has a scale factor of 3 from the original red square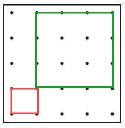
- Dot or Grid Paper
green rectangle has a scale factor of 2 from the original red rectangle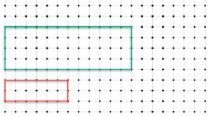
- Geoboards
- Have students construct scale drawings of the classroom, school, their homes and/or backyards or other familiar places where they can take measurements (MTR.7.1).
- Instruction includes the understanding that if the scaling factor is , then the constant of proportionality between corresponding areas is ². Once students have become comfortable with scaling dimensions, extend their knowledge to solving problems with area. Provide several figures where students will determine new dimensions based on a given scale factor. Have students then calculate the original and new perimeters, as well as the original and new areas. Then analyze/compare the scale factors used in scaling the perimeters versus the scale factors used for area (MTR.1.1, MTR.4.1).
- Instruction supports flexibility in the variable used for the constant of proportionality.
Common Misconceptions or Errors
- Students may not understand how to read a map. To address this misconception, practice map reading skills, using familiar areas when possible.
- Students may incorrectly scale area in the same way they scale side length. To address this misconception, have students calculate areas of similar figures prior to determining the scale factor between the figures, then make comparisons. Interactive software can also be used to demonstrate.
- Students may incorrectly set up their proportions.
- Students may believe the scale factor is always greater than 1.
- For example, students may respond the scale factor is 2 when it is .
Strategies to Support Tiered Instruction
- Teacher provides instruction utilizing different types of maps to familiarize students with how to read a map and the key features of a map. Teacher can choose maps that are familiar to students within their region.
- Instruction includes the use of geometric software to allow students to explore the area of an original figure versus its scale and draw conclusions on the impact of scale factor.
- Teacher co-creates a graphic organizer with students containing examples of applying a scale factor to a length or to an area.
- Teacher provides instruction focused on color-coding and labeling the different units when setting up a proportional relationship to ensure corresponding units are placed in corresponding positions within the proportion.
- Teacher has students calculate areas of figures where the side lengths of one figure is a constant multiple of the corresponding side lengths of the other figure prior to determining the scale factor between the figures. Students can then make comparisons between the areas of the figures. Interactive software can also be used to demonstrate.
Instructional Tasks
Instruction Task 1 (MTR.7.1)Many supersonic jet aircraft in the past have used triangular wings called delta wings. Below is a scale drawing of the top of a delta wing.
- Scale: 2 centimeters (cm) in the drawing equals 192 cm on the actual wing.
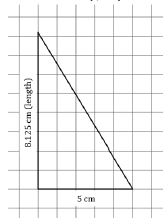
- Part A. What is the length of the actual wing? Explain how you found your answer.
- Part B. What is the area of the actual wing? Explain how you found your answer.
Mariko has an 80:1 scale-drawing of the floor plan of her house. On the floor plan, the dimensions of her rectangular living room are 1 inches by 2 inches. What is the area of her real living room in square feet?
Instructional Items
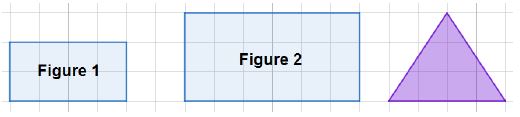
Instructional Item 1The triangle below needs to be recreated using the scale factor that produced Figure 2 from Figure 1. What is this scale factor?
Instructional Item 2
Andrew needs to repaint the side of his building white to prepare for a new mural that will be painted there. He measured the actual wall to be 26.25 feet long but he cannot easily measure the height. On his blueprints of the building, the wall measures 3.5 inches long and 4 inches tall. To determine how much paint to buy, calculate the area of the wall Andrew needs to cover.
*The strategies, tasks and items included in the B1G-M are examples and should not be considered comprehensive.