Standard #: MA.6.DP.1.1


This document was generated on CPALMS - www.cpalms.org


Recognize and formulate a statistical question that would generate numerical data.


Examples


The question “How many minutes did you spend on mathematics homework last night?” can be used to generate numerical data in one variable.

General Information

Subject Area: Mathematics (B.E.S.T.)
Grade: 6
Strand: Data Analysis and Probability
Status: State Board Approved

Benchmark Instructional Guide

Connecting Benchmarks/Horizontal Alignment


Terms from the K-12 Glossary

  • Data
  • Statistical Question


Vertical Alignment

Previous Benchmarks

Next Benchmarks


Purpose and Instructional Strategies

In elementary grades, student collect numerical and categorical data to construct tables and graphs. In grade 6, students are formally introduced to statistical information and formulating statistical questions for numerical data. In grades 7 and 8, students will extend this when working with categorical data and then with bivariate data (MTR.1.1, MTR.4.1)
  • Statistics are numerical data relating to a group of individuals; statistics is also the name for the science of collecting, analyzing and interpreting such data. It is a method for translating a real-world context into a collection of numbers. A statistical question anticipates an answer that varies from one individual to the next and is written to account for the variability in the data. Data are the numbers produced in response to a statistical question. Data are frequently collected from surveys or other sources (i.e., documents).
  • Instruction focuses on statistical questions that generate numerical data. Once the data is gathered, it can be organized in a table or displayed in a graph.
  • Instruction includes the understanding of a statistical question and a non-statistical question. A statistical question can be answered by collecting information that addresses differences in a population. A statistical question concerns some characteristic of a collection of individuals rather than of one specific individual.
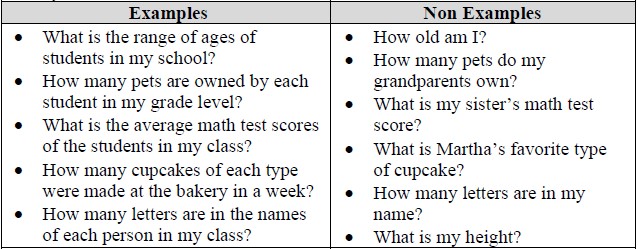
    • For example, the question “How tall am I?” is not a statistical question because there is only about a single individual and there is only one response; however, “How tall are the students in my class?” is a statistical question since it can be answered by gathering information from many students and it is anticipated that this information will vary from one student to the next.
  • Survey questions can be used to collect data to gather information for a statistical question.
    • For example, the questions “What are the shoe sizes of the students in your class?” and “What is the average shoe size of the students in your class?” can be construed as statistical questions if your students are to gather the data to try to answer them. They might gather this data by asking the survey question “What is your shoe size?”
      Table
      Table
  • For numerical data, statistical questions can result in a narrow or wide range of numerical values. To collect this information, students design a survey question that anticipates variability by providing a variety of possible anticipated responses that have numerical answers, such as 3 hours per week, 4 hours per week and so on. Be sure questions have specific numerical answers.
  • Well written statistical questions refer to the following two aspects: population of interest, measurement of interest, and such a question anticipates answers that vary.
  • Instruction includes students determining how statistical questions imply that there was data gathered in order to determine a measure of center or measure of variation.
    • For example, the statistical question “How much money does a household in Lake County generally spend on internet in a year?” implies that one must gather numerical data on the cost of internet for households in Lake County to determine how much is generally, or on average, spent.
  • Instruction includes the understanding that statistical questions are not limited to data that can be gathered by students themselves.
    • For example, the question “What are the ten largest cities in Florida?” can be considered a statistical question because data was collected to determine this.


Common Misconceptions or Errors

  • Students may believe that all the questions that they write are statistical questions. Students need to understand that a statistical question must have a range of numerical answers. They will need to have sample questions and practice writing their own.
  • Students may think that a survey question is a statistical question, since a survey question can be used to answer a statistical question. A statistical question concerns a population. A survey question is asked of individuals in a population to help answer a statistical question.


Strategies to Support Tiered Instruction

  • Teacher provides a list of examples of statistical questions and what qualifies them as statistical to assist students who incorrectly label non-statistical questions.
  • Teacher provides simple examples that show how a statistical question concerns an entire population and a survey question concerns an individual within a population. Survey questions can be used to gather data to answer statistical questions.
    • For example, the statistical question “What is the average height at your school?” can be answered by gathering data using the survey question “What is your height?”.
  • Teacher provides instruction focused on patterns that make statistical questions and how to change non-statistical questions into statistical questions. Teachers work with students on examples to determine if each question is statistical or non-statistical. If the question is non-statistical, teacher models how they can convert it to be a statistical question.
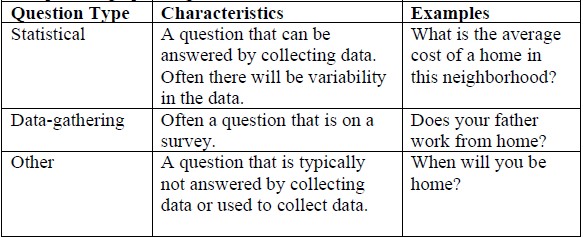
  • Teacher provides a list and co-constructs a graphic organizer and determines the pattern from statistical and non-statistical questions. Students will have opportunity to explain why each one is either statistical or non-statistical.
    • For example, “What are the ten largest cities in Florida?” can be considered a statistical question because one must gather data on all of the cities in the state of Florida. A survey question that can be used to answer this statistical question is “What is the population of your city?”
    • For example, “How many movies did you watch last month?” can be considered a survey question which can be used to answer various statistical questions like “What is maximum and minimum number of movies watched last month?” or “What is the average number of movies watched last month by 6th graders?”
    • Example of a graphic organizer is shown below.
      Table
  • Teacher provides sample questions and models how to practice writing their own.


Instructional Tasks

Instructional Task 1 (MTR.7.1)
Write a statistical question that will require data that could be collected from your class to provide information to an advertising agency for teenagers to purchase clothing, shoes, backpacks or school supplies.
  • a. Design a table for data collection.
  • b. Create a proposal to the advertising agency to recommend an item to advertise based on the data you collected from your statistical question. Include data to support your recommendation.


Instructional Items

Instructional Item 1
Amir collected data from his sixth-grade class at Liberty Middle School. He asked about the amount of time students spent playing video games. Write a statistical question associated with his data.

Instructional Item 2
Which of the questions below are statistical?
a. Are there typically more manatees in Tarpon Springs or in Blue Springs?
b. How many Instagram followers does Mr. Youmans have?
c. How many points did the basketball team score in its last game?
d. What is the range of photos students in Ms. Alvarez’s class have on their phone?
e. How many minutes a week do 8th graders at Bridgton Middle School spend watching TV?


*The strategies, tasks and items included in the B1G-M are examples and should not be considered comprehensive.


Related Courses

Course Number1111 Course Title222
1205010: M/J Grade 6 Mathematics (Specifically in versions: 2014 - 2015, 2015 - 2022, 2022 - 2024, 2024 and beyond (current))
1205020: M/J Accelerated Mathematics Grade 6 (Specifically in versions: 2014 - 2015, 2015 - 2020, 2020 - 2022, 2022 - 2024, 2024 and beyond (current))
1204000: M/J Foundational Skills in Mathematics 6-8 (Specifically in versions: 2014 - 2015, 2015 - 2022, 2022 - 2024, 2024 and beyond (current))
7812015: Access M/J Grade 6 Mathematics (Specifically in versions: 2014 - 2015, 2015 - 2018, 2018 - 2022, 2022 and beyond (current))


Related Access Points

Access Point Number Access Point Title
MA.6.DP.1.AP.1 Identify statistical questions from a list that would generate numerical data.


Related Resources

Formative Assessments

Name Description
Questions About a Class

Students are asked to determine whether or not questions are statistical and justify their responses.

TV Statistics

Students are asked to write a statistical question and explain why it is statistical.

Lesson Plans

Name Description
Show Me the Money

Students will create a statistical question and collect and analyze data using relative frequency tables. They will present their argument in hopes of earning a cash prize for their philanthropy. An iterative process of critique and refinement will take place. A student packet is included that guides all parts of the lesson.

Statistical Question Sort

In this lesson, students will explore statistical questions. Students will be able to create statistical questions and understand when a question is non-statistical. This lesson incorporates a YouTube video, direct instruction, and a question sort. By the end of the lesson, students will be able to write their own statistical questions for future statistical lessons.

Survey Says

This lesson addresses statistical and non-statistical questions. The hook will be getting the students talking about what is exciting about shows like "The Family Feud" and how the questions on these shows are examples of statistical questions because they yield numerical answers that vary from one individual to another. The students will have several attempts to identify statistical or non-statistical questions.

What is a Question?

Students will learn how to recognize and formulate a statistical question. After a statistical question is established, students will engage in collecting data from their classmates. The lesson concludes with student presentations of analyzed data and conclusions about the topic selected.

Advantages and Disadvantages of Dot Plots, Histograms, and Box Plots

Students will compare the advantages and disadvantages of dot plots, histograms, and box plots. During this lesson, students will review the statistical process and learn the characteristics of a statistical question; whether it be numerical or categorical. Students will apply the information learned in a project that involves real-world issues and make an analysis based on the data collected.

Inferences

This lesson shows students how to conduct a survey and display their results. The lesson takes the students through:

  1. What is a statistical question?
  2. General population versus sample population.
  3. What is a hypothesis?
  4. What is a survey?
  5. How to make inferences.
Selecting a Sample Population

The student explores several strategies for selecting a sample population to support making inferences about the population.

Generating Multiple Samples to Gauge Variation

Students explore variation in random samples and use random samples to make generalizations about the population.

Statistically Speaking Part II: An Investigation of Statistical Questions and Data Distribution

This lesson is Part 2 of 2 and uses an inquiry-based learning method to help students recognize a statistical question as one that anticipates variability in the data. Through cooperative learning activities, the students will develop an understanding of how to analyze the collected data to answer a statistical question. Students will complete a statistical research project in teams. Since this lesson focuses on math concepts related to identifying clusters, gaps, outliers, and the overall shape of a line plot, it will help students build a strong foundation for future concepts in the statistics and probability domain. The corresponding lesson is Statistically Speaking Part I: An Investigation of Statistical Questions and Data Distribution, Resource ID 48649.

Statistical Question?

The lesson will start by assessing prior knowledge about asking varied questions. To hook the students, the teacher will ask students questions to which they must decide if they are statistical or non-statistical. Finally, the teacher will ask students to volunteer questions so the class can discuss why or why not the question is statistical.

Statistically Speaking Part I: An Investigation of Statistical Questions and Data Distribution

This lesson is Part 1 of 2 and uses the inquiry-based learning method to help students recognize a statistical question as one that anticipates variability in the data. Through cooperative learning activities, students will learn how to analyze the data collected to answer a statistical question. Since this lesson focuses on math concepts related to identifying clusters, gaps, outliers, and the overall shape of a line plot, it will help students build a strong foundation for future concepts in the statistics and probability domain. Part 2 of this lesson is Resource ID #49091.

Be the Statistician

Students will utilize their knowledge of data and statistics to create a question, collect numerical data, and create a display of their data driven by its quantitative measures of center and variability; mean, median, mode, and range.

Punkin Chunkin - An Engineering Design Challenge

This Engineering Design Challenge is intended to help students apply the concepts of the transfer of potential and kinetic energy. It is not intended as an initial introduction to this benchmark.

Perspectives Video: Professional/Enthusiast

Name Description
Determining Remote Locations with Math

Ecologist, Rebecca Means, describes the process of determining remote locations in the USA and developing quantitative questions that are appropriate.

Download the CPALMS Perspectives video student note taking guide.

Problem-Solving Task

Name Description
Buttons: Statistical Questions

Students are given a context and a series of questions and are asked to identify whether each question is statistical and to provide their reasoning. Students are asked to compose an original statistical question for the given context.

Text Resource

Name Description
Whole Lotta Shakin' Goin' On: Busy Stretch for Large Earthquakes

This article is intended to support reading in the content area. The text investigates whether the number of large magnitude earthquakes has significantly increased. The article explores the challenge of trying to determine why the amount and intensity of earthquakes can vary across time. The text also briefly explores the recent rise in man-made earthquakes.

Tutorial

Name Description
Statistical Questions

Discover what makes a question a "statistical question."

Student Resources

Problem-Solving Task

Name Description
Buttons: Statistical Questions:

Students are given a context and a series of questions and are asked to identify whether each question is statistical and to provide their reasoning. Students are asked to compose an original statistical question for the given context.

Tutorial

Name Description
Statistical Questions:

Discover what makes a question a "statistical question."


Parent Resources

Problem-Solving Task

Name Description
Buttons: Statistical Questions:

Students are given a context and a series of questions and are asked to identify whether each question is statistical and to provide their reasoning. Students are asked to compose an original statistical question for the given context.


Printed On:4/19/2025 6:57:34 AM
Print Page | Close this window