
General Information
Subject Area: Mathematics (B.E.S.T.)
Grade: 6
Strand: Algebraic Reasoning
Date Adopted or Revised: 08/20
Status: State Board Approved
Benchmark Instructional Guide
Connecting Benchmarks/Horizontal Alignment
Terms from the K-12 Glossary
- Rate
- Unit Rate
Vertical Alignment
Previous Benchmarks
Next Benchmarks
Purpose and Instructional Strategies
In elementary grades, students developed understanding of fraction concepts and operations, often in the context of the relationship that relates parts to wholes. In grade 6, students use tables to display parts to parts and parts to whole relationship, as preparation for understanding a constant ratio relationship between two quantities. In grade 7, students will achieve a more formal understanding of the constant of proportionality and proportional relationships, which can be represented by tables, equations and graphs.- Instruction includes discussion about how the patterns that students see in the tables can help them reason through various situations (MTR.4.1, MTR.5.1).
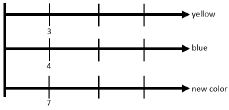
- Instruction includes the use of acting out scenarios, bar models, tables and number lines in order to see relationships and relevance to real-world application (MTR.2.1).
- Bar Model
- Tables
- Number Lines
- Bar Model
Common Misconceptions or Errors
- Students may be looking for arithmetic or counting patterns within the table and not seeing multiplicative patterns between the ratio values.
Strategies to Support Tiered Instruction
- Instruction includes the use of whole number parts to allow for students to explore the various relationships in the tables before introducing positive rational values. Discussions include additive and multiplicative patterns amongst the rows and the columns of the table.
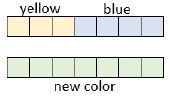
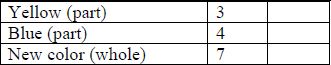
- Instruction includes the use of two different counters to represent the provided ratios with emphasis on the different colors representing the parts and the total number of counters representing the whole. Teacher allows for opportunities for the student to explore equivalent ratios by adding addition sets of counters or by dividing the existing counters into equal groups and recording the equivalent ratios in a two-or three-column table.
- For example, students can use the counters to help complete the table to express the relationship between the number of students and the number of adults on a recent field trip.

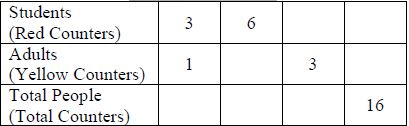
- For example, students can use the counters to help complete the table to express the relationship between the number of students and the number of adults on a recent field trip.
Instructional Tasks
Instructional Task 1 (MTR.4.1, MTR.7.1)Jeremy is making punch for a party. The relationship between the cups of syrup and the cups of water he used to create the punch mixture is shown on the table below.
- Part A. Complete the table. Explain the process you used to complete the table.
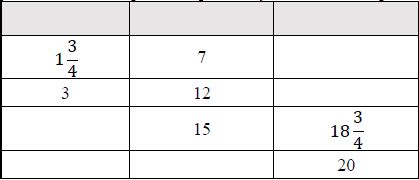
- Part B. If Jeremy needs 30 cups of punch, how many cups of syrup are needed? How many cups of water are needed?
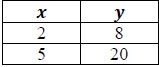
Instructional Task 2 (MTR.3.1)
Given the table below, determine the common ratio between the x-and y-values.
Instructional Items
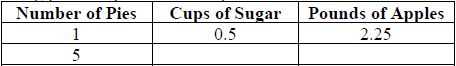
Instructional Item 1Shambria is making pies and part of the recipe she uses is described in the table below.
Instructional Item 2
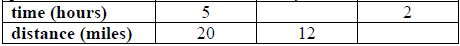
The table below describes the same rate at which Drew hiked along the Appalachian Trail each day. Complete the table and determine how many miles he could hike in 2 hours.
*The strategies, tasks and items included in the B1G-M are examples and should not be considered comprehensive.