Collect and represent numerical data, including fractional and decimal values, using tables, line graphs or line plots.
Gloria is keeping track of her money every week. She starts with $10.00, after one week she has $7.50, after two weeks she has $12.00 and after three weeks she has $6.25. Represent the amount of money she has using a line graph.
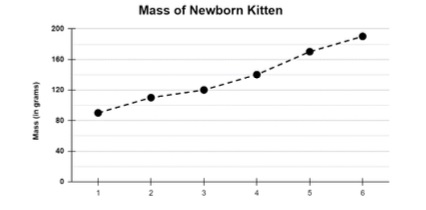
Within this benchmark, the expectation is for an estimation of fractional and decimal heights on line graphs.
| Name |
Description |
| Sleep Versus Mood | Using the case study, No Sleep, No Problem? Students will explore the amount of sleep they are allotting for themselves per night. Students will then investigate the impact of sleep on one’s daily mood. |
| How Generative AI like ChatGPT Works | Students will explore Artificial Intelligence (AI) and how generative AI models use Large Language Models (LLMs) and Natural Language Processing NLP to generate outputs. This grades 4-5 lesson is an integrated Computer Science, ELA and Math lesson designed for application of math and ELA content knowledge while exploring and using computational thinking to understand how generative AI works, making cross-curricular connections to understand emerging technologies. |
| Voting Rights Amendments: The Voting Rights Act of 1965 | In this lesson plan, students will create and analyze a line graph to explore how the Voting Rights Act of 1965 expanded civic participation. |
| Voter Turnout and the 26th Amendment | In this lesson plan, students will graph and interpret voter turnout data to explain how the 26th Amendment expanded the opportunity for civic participation. |
| Voter Turnout and the 24th Amendment | Students will use voter turnout data to create and analyze a line graph to explain how the 24th Amendment expanded civic participation in this integrated lesson plan. |
| Voter Turnout and the 19th Amendment | Students will graph and analyze voting data to explain how the 19th Amendment expanded civic participation in this lesson plan. |
| Voter Turnout and the 15th Amendment | In this lesson plan, students will graph and analyze voting data to explain how the 15th Amendment expanded civic participation. |
| Heatin' It Up or Coolin' It Down | Many chemical reactions are accompanied by a change in temperature. Whether it is extreme or barely noticeable, the temperature may go up or it may go down. Investigate these two chemical reactions described in this lesson to experience two different kinds of temperature change.
|
| Line Plotting with Fractions Chicago Pizza Style | In this lesson, students will be making a line plot and recording fractional data (1/4, 1/2, and 3/4) on their line plot. Students will then use fraction operations to solve problems involving data presented in their line plots. |
| April Showers Bring May Flowers - Line Plots | In this lesson, students will create a line plot that displays rainfall data. They will use the data from the line plot to answer questions using addition, subtraction, multiplication, and division of fractions. Please note that the denominators for the line plot go to eighths.
|
| What is in the PLOT? | In this lesson students will use Florida's wonderful seashells to collect data sets of measurement in fractions of a unit (1/2, 1/4, 1/8). They will plot the data on a line plot, then use operations with fractions to solve problems involving information presented in the line plot. |
| Black Out in an Ice Cream Shop! | This Model Eliciting Activity (MEA) asks students to develop a procedure for choosing a back-up energy source (generator) for an ice cream shop. Students will need to consider Cost of unit, wattage output, size of fuel container, length of time this machine will run, auto turn on, and the number of outlets it can receive. In the second portion of the problem statement, the students will need to prepare and compare the cost of use for 24 hour period. They will need to determine if they have still made the correct choices while adding three more generators for consideration, and make a cost analysis for 24 hours of use. In the culminating activity, the students will write a proposal for the client for the generator of their choice and include the 24 hours cost analysis.
Model Eliciting Activities, MEAs, are open-ended, interdisciplinary problem-solving activities that are meant to reveal students’ thinking about the concepts embedded in realistic situations. MEAs resemble engineering problems and encourage students to create solutions in the form of mathematical and scientific models. Students work in teams to apply their knowledge of science and mathematics to solve an open-ended problem while considering constraints and tradeoffs. Students integrate their ELA skills into MEAs as they are asked to clearly document their thought processes. MEAs follow a problem-based, student-centered approach to learning, where students are encouraged to grapple with the problem while the teacher acts as a facilitator. To learn more about MEAs visit: https://www.cpalms.org/cpalms/mea.aspx |
| Storage for Storage | In this MEA, 5th Grade students will work in teams to determine a procedure for ranking Storage Sheds for a construction company that is moving to a new facility to purchase. Students will need to calculate the square feet and cubic feet of space for the Storage Shed, make decisions based on a table of data, and write a letter to the client providing evidence for their decisions.
Model Eliciting Activities, MEAs, are open-ended, interdisciplinary problem-solving activities that are meant to reveal students’ thinking about the concepts embedded in realistic situations. MEAs resemble engineering problems and encourage students to create solutions in the form of mathematical and scientific models. Students work in teams to apply their knowledge of science and mathematics to solve an open-ended problem while considering constraints and tradeoffs. Students integrate their ELA skills into MEAs as they are asked to clearly document their thought processes. MEAs follow a problem-based, student-centered approach to learning, where students are encouraged to grapple with the problem while the teacher acts as a facilitator. To learn more about MEAs visit: https://www.cpalms.org/cpalms/mea.aspx |