
General Information
Subject Area: Mathematics (B.E.S.T.)
Grade: 5
Strand: Geometric Reasoning
Date Adopted or Revised: 08/20
Status: State Board Approved
Benchmark Instructional Guide
Connecting Benchmarks/Horizontal Alignment
Terms from the K-12 Glossary
- Coordinate Plane (first quadrant)
- Origin
- x-axis
- y-axis
Vertical Alignment
Previous Benchmarks
Next Benchmarks
Purpose and Instructional Strategies
The purpose of this benchmark is for students to interpret coordinate values plotted in mathematical and real-world contexts. Students have been plotting and interpreting numbers on a number line since Kindergarten. Students’ first experience with interpreting points plotted on a coordinate plane is in grade 5, which leads to the foundational understanding needed throughout middle school.- An example of interpreting coordinate values of points in a mathematical context could be identifying points of a rectangle plotted on the coordinate plane.
- An example of interpreting coordinate values of points in a real-world context could look like the example in the benchmark description. In this real-world example, students would interpret that each axis represents a variable describing a situation. The x-axis represents number of weeks and the y-axis represents plants’ heights in inches.
- During instruction, teachers should provide plenty of opportunities for students to both plot and interpret ordered pairs on a coordinate plane. Teachers should connect the expectations of this benchmark with MA.5.GR.4.1 by having students represent the points plotted on two-column tables as well (MTR.4.1, MTR.7.1).
- In real-world contexts teachers should allow students the flexibility to decide which variable is represented by x and which is represented by y. Students may be encouraged to explain their preference.
- During instruction, students should be given the flexibility to decide how to scale their graphs for a given real-world context. Students may be encouraged to explain their preference.
Common Misconceptions or Errors
- Students can confuse the x- and y-values in an ordered pair and move vertically along the y-axis before moving horizontally along the x-axis.
- For example, they may mean to plot and label the ordered pair (2, 4), but plot and label (4, 2) instead.
- Some students may not understand what an x- or y-coordinate value of 0 represents. During instruction, students should justify why ordered pairs with a 0 will plot on the x- axis or y-axis.
Strategies to Support Tiered Instruction
- Instruction includes the teacher providing coordinate points to graph in quadrant 1 of the coordinate plane along with two small objects. The students explain how they move the object along the x-axis and then up the y-axis to the location provided. The teacher then provides the points reversed to graph and has students explain the difference in how they move the second object compared to the first.
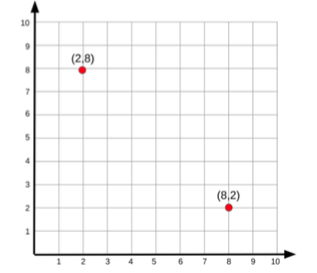
- For example, the teacher may provide students with a coordinate plane like the one shown below. The teacher provides a set of coordinate points such as (8,2). Students take turns moving an object, such as a two-colored counter, and explain the location of the point using the x- and y-axis in their explanation. The teacher will then provide the points in reverse, (2,8). Students will move a second object and explain the location of the point as well as the difference between the two locations.
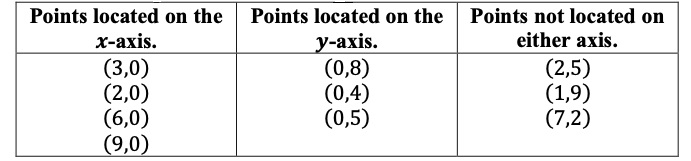
- Instruction includes the teacher providing a set of cards that have coordinates points on them, some with 0 as the location on the x-axis, some with 0 as the location on the y- axis, others with no 0 in the coordinates. Students sort the cards into three categories: points located on the x-axis, points located on the y-axis and neither. Students justify their reasoning by explaining how the 0, or lack of a 0, in each set of points helped them.
- For example, the teacher provides cards with the following points on them: (2,5), (0,8), (3,0), (2,0), (1,9), (0,4), (6,0), (7,2), (9,0), (0,5)
- Students sort the points into three categories as shown below.
- Instruction includes the teacher creating a giant coordinate plane on the floor with painters' tape or outside with sidewalk chalk. The teacher or a student will then create directions for their peers to follow. The teacher or student provides a set of coordinate points, including those with 0 as the x- or y-coordinate. Another student physically moves to the location, describing as they move, which axis they are moving on and counting the spaces until they reach their final location.
- For example, the teacher or a student tells another student to move to the location of (4,6) on the coordinate plane. The student says, “I begin at the origin which is (0,0) and move 1, 2, 3, 4 spaces to the right on the x-axis. I then move 1, 2, 3, 4, 5, 6 spaces up on the y-axis to my final location of (4,6).”
- For example, the teacher provides a student with the location (5,0). The student moves along the x-axis 5 spaces and stop. The teacher provides another student with the location (0,5). That student moves up the y-axis 5 spaces and stop. The teacher then has students explain how their location ended up on the x- or y-axis as well as the relationship between those located on the y-axis and those located on the y-axis.
Instructional Tasks
Instructional Task 1 (MTR.7.1)
Lukas can make four bracelets per hour and he will work for five hours. Make a two-column table where the first column contains the numbers 1, 2, 3, 4, 5 indicating the number of hours worked, and the second column shows how many total bracelets he has made in that many hours.Plot points on the coordinate plane to represent your table, where the x-coordinate represents the number of hours worked and the y-coordinate represents the number of bracelets made.
Instructional Items
Instructional Item 1
The map below shows the location of several places in a town.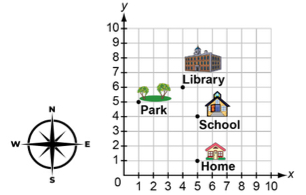
The fire department is 2 blocks north of the library. What ordered pair represents the location of the fire department?
- a. (4, 2)
- b. (2, 4)
- c. (4, 8)
- d. (8. 4)
Instructional Item 2
Deanna is plotting a square on the coordinate plane below.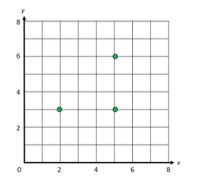
What ordered pair would represent the fourth vertex?
- a. (6, 2)
- b. (2, 6)
- c. (2, 0)
- d. (0, 2)
*The strategies, tasks and items included in the B1G-M are examples and should not be considered comprehensive.