
General Information
Related Benchmarks:
MA.8.A.1.2
Reporting Category: Algebra
Type: MC: Multiple Choice
Difficulty: N/A
Question:
The production manager of a furniture manufacturing company plotted values on the graph below to show how the production cost per chair decreases as the number of chairs produced increases. The slope of the dashed line segment joining these points is -1/8.
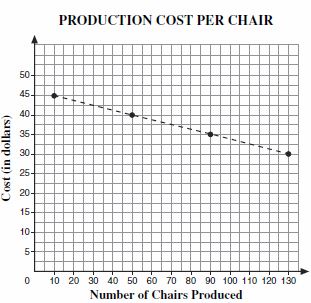
What does this slope of the dashed line segment represent?
Answer Options:
A. Each chair produced decreases costs by $5.
B. Each chair produced decreases costs by $8.
C. For every 8 chairs produced, costs decrease by $1.
D. For every 10 chairs produced, costs decrease by $5.
B. Each chair produced decreases costs by $8.
C. For every 8 chairs produced, costs decrease by $1.
D. For every 10 chairs produced, costs decrease by $5.
Answer Key:
C
Item Context:
Social Studies/Consumerism