
General Information
Related Benchmarks:
MA.3.S.7.1
Reporting Category: Statistics
Type: MC: Multiple Choice
Difficulty: N/A
Question:
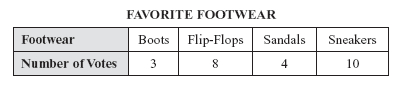
The students in Mrs. Livingston’s class voted for their favorite kind of footwear. The number of votes are shown on the table below.
Answer Options:
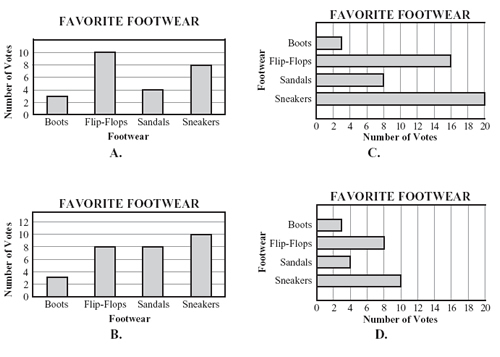
Answer Key:
D
Item Context:
Mathematics