Clarifications:
Essential Understandings
Concrete:
- Make predictions based upon data presented in a line graph or table.
- Make predictions based on data represented in an exponential or logarithmic graph or table.
- Indicate the point on a graph that crosses the y-axis.
- Compare two rates of change on a graph.
- Compare two rates of change in a display.
- Describe the rate of change qualitatively (e.g., steep = rapid rate of change).
Click Here - Use tools to compare models of functions with standard logarithmic models
Click Here - Use a template to compare function models with standard logarithmic functions. For example: use the graph of a function to determine which of the functions below best models the given function.


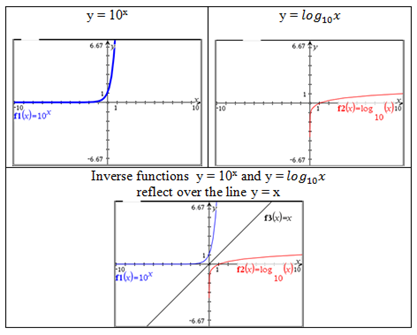
- Understand that a calculator log button uses base 10.
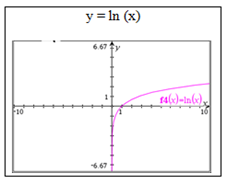
- Understand that a calculator ln button uses base e.
- Use a tool (graphing calculator, scientific calculator, etc..) to solve for exponent. For example: 69.18 =
 , log 69.18 = x. 1.84 = x
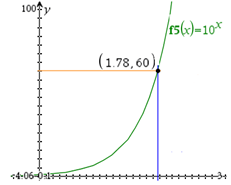
 - Understand that the exponent represents a value on the x axis and the answers represent values on the y axis for an exponential function base 10 or e.

- Use a tool (graphing calculator, scientific calculator, etc..) to solve for exponent.
For example:
x=1.386
| Number: MAFS.912.F-LE.1.AP.4b | Category: Access Points |
| Date Adopted or Revised: 06/14 |
Cluster:
Construct and compare linear, quadratic, and exponential models and solve problems. (Algebra 1 - Supporting Cluster) (Algebra 2 - Supporting Cluster) : Clusters should not be sorted from Major to Supporting and then taught in that order. To do so would strip the coherence of the mathematical ideas and miss the opportunity to enhance the major work of the grade with the supporting clusters. |

 = d where a, c, and d are numbers and the base b is 2, 10, or e;
evaluate the logarithm using technology.