
Clarifications:
Essential Understandings
Concrete:
- Given a scatter plot, identify the two variables.
- Plot points on a scatter plot.
- Draw a line of best fit (i.e., use a transparency to place a line over the data in a scatter plot or a strand of spaghetti or a pipe cleaner to represent the line of best fit).
- Match the line with the statement describing the relationship between the variables (are the data points moving up to the right or left, positive or negative correlation).

- Identify the relationship (fit) between the data and the function (e.g., linear, non-linear).
- Understand the following concepts and vocabulary: scatter plot, variables, positive/negative correlation, linear, non-linear and line of best fit.
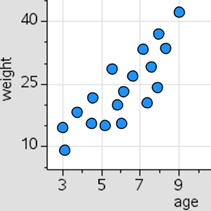
º e.g., As the age increases (gets larger), the weight also increases (gets larger).
| Number: MAFS.912.S-ID.2.AP.6b | Category: Access Points |
| Date Adopted or Revised: 06/14 |
Cluster:
Summarize, represent, and interpret data on two categorical and quantitative variables. (Algebra 1 - Supporting Cluster) (Algebra 2 - Supporting Cluster) : Clusters should not be sorted from Major to Supporting and then taught in that order. To do so would strip the coherence of the mathematical ideas and miss the opportunity to enhance the major work of the grade with the supporting clusters. |